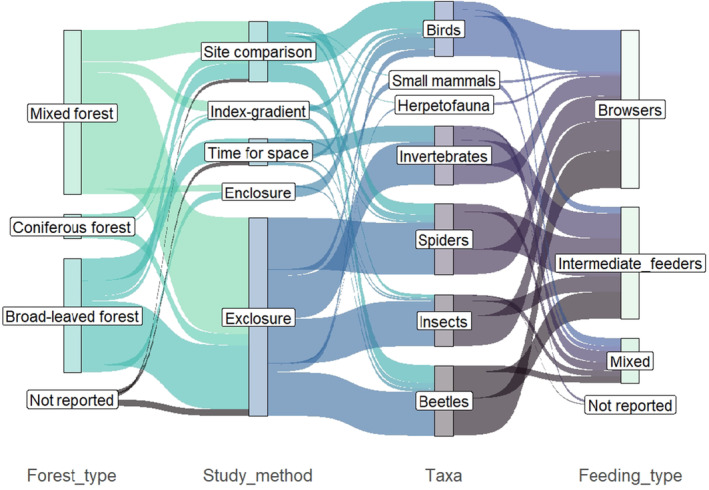
FIGURE 7.

Sankey plot displaying the frequency of which faunal taxa were studied in relation to deer feeding type, methodological approach, and forest type. The method “index‐gradient” refers to studies using continuous indices, for example, from pellet counts as indirect variables representing deer abundance.
