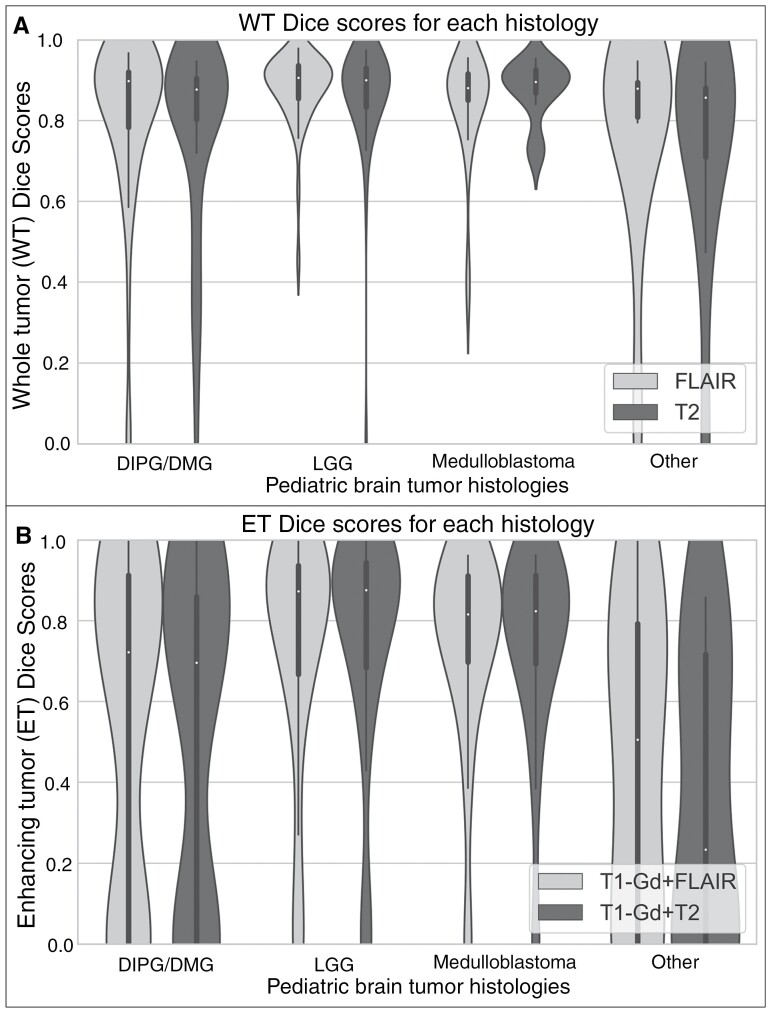
Figure 4.
Violin plots showing the distribution of whole tumor (WT) Dice scores using the T2 or FLAIR tumor segmentation model for different histologies (A). There is no significant difference in the Dice scores between T2 and FLAIR inputs for different tumor histologies. Violin plots showing the distribution of enhancing tumor (ET) Dice scores using the T1-Gd and T2 or FLAIR tumor segmentation models for the different histologies (B). Enhancing tumor Dice scores from LGG and medulloblastoma patients were significantly higher than those from DIPG/DMG and other histologies (all P < .0.5).

