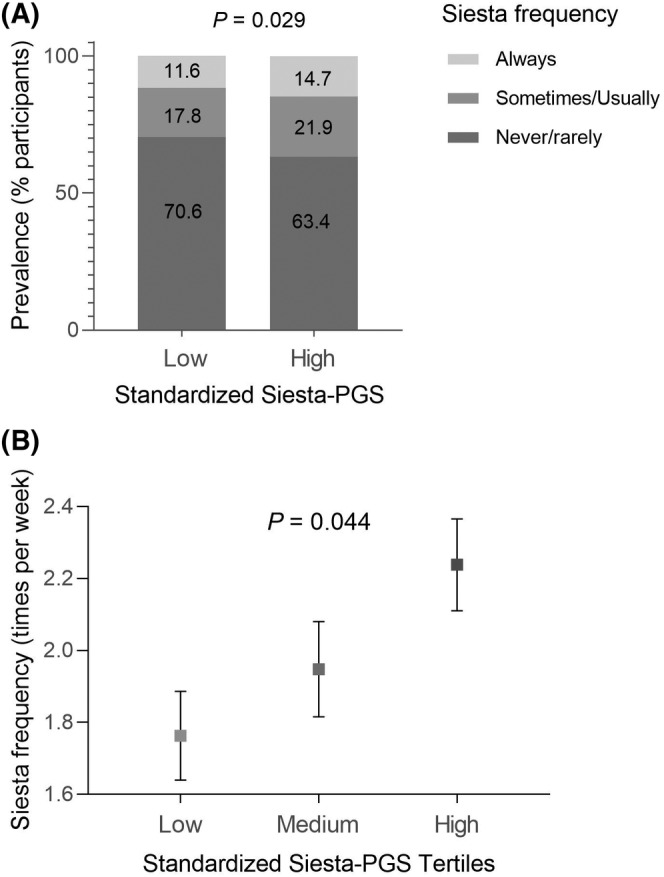
FIGURE 2.

(A) Differences in the prevalence of siesta (always, sometimes/usually, and never/rarely) in participants with low genetic propensity for siesta (siesta‐polygenic score [PGS] ≤ 0) and high genetic propensity for siesta (Siesta‐PGS > 0). (B) Average siesta frequency (times per week) in each Siesta‐PGS tertile (standardized). Error bars represent SEM.
