
FIGURE 4.
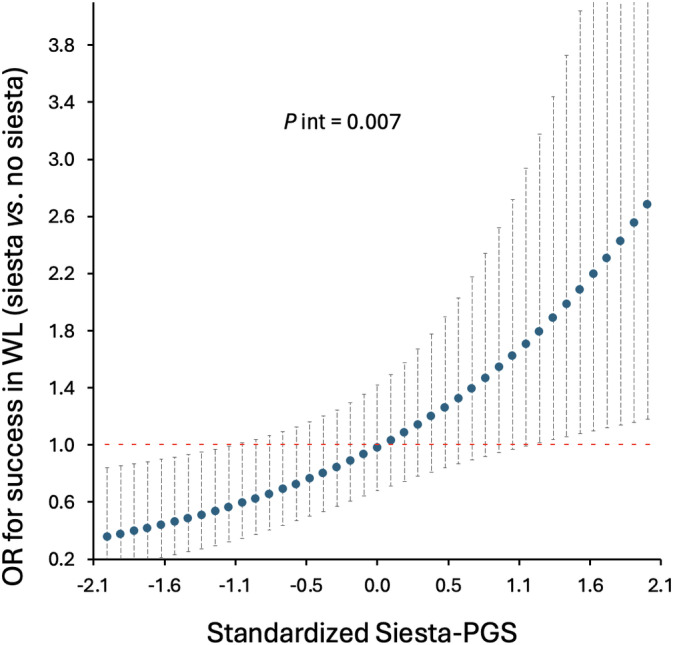
Association between siesta (usually/always) compared with no siesta (sometimes/never) and success in weight loss (WL) as a function of Siesta‐Polygenic Score (Siesta‐PGS; secondary result). Odds ratio (OR) and 95% CI. Interaction p value (P int) from likelihood ratio test. After exploratory analyses, the sometimes/never category includes frequency of siesta of never or once, twice, or three times per week, and the usually/always category includes frequency of siesta four to seven times per week. For example, for the lowest Siesta‐PGS standardized value (−2.1; i.e., lower siesta genetic propensity), those who usually take siesta have an OR of success in WL 0.2 lower than those who do not take siesta, whereas, among those participants with the highest genetic propensity for siesta (Siesta‐PGS value 2.1), those who usually take siesta have an OR of success in WL 2.6 higher than those who do not take siesta. [Color figure can be viewed at wileyonlinelibrary.com]