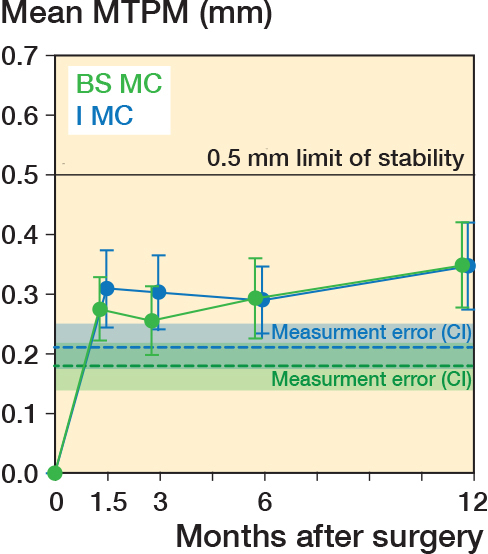
Figure 4.

Plot of mean maximum total point motion (MTPM) of the tibial baseplate for the BS MC insert (green) and I MC insert (dark blue) over 1 year. Error bars represent the 95% confidence intervals on the means. Mean measurement error (dashed lines) and 95% confidence limits (shaded area) determined from double examinations are shown.
