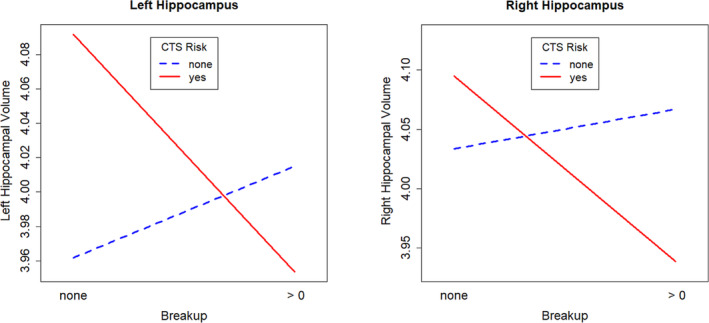
FIGURE 2.

Interaction plot of CTS Risk and the experience of at least one romantic relationship breakup (breakup) on hippocampal volumes.
Disordinal interactions between CTS Risk and breakup (breakup = 0/breakup>0) were observed for both left and right hippocampal volumes [cm3] (N = 196; left hippocampus: β = −0.24 ± 0.10, p = 0.016, p (FDR) = 0.018; right hippocampus: β = −0.23 ± 0.10, p = 0.018, p (FDR) = 0.018).
