
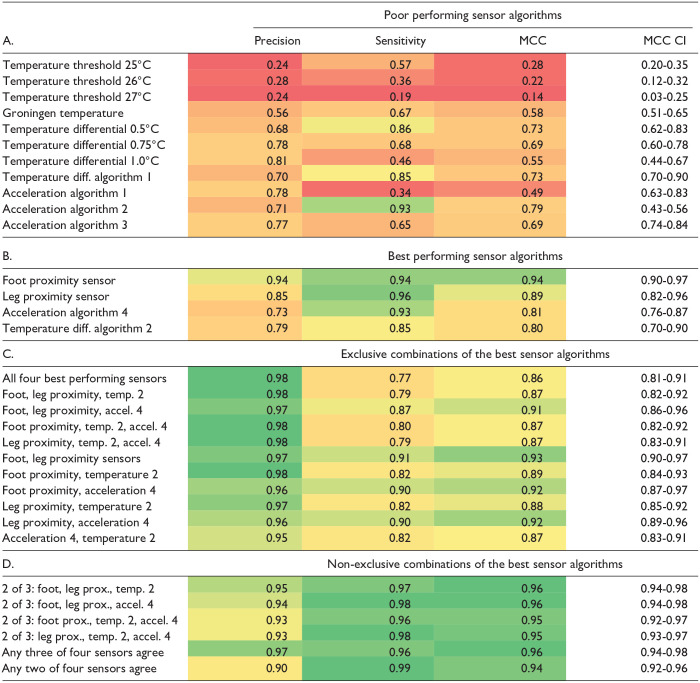
Table 3.
Heatmap of Predictive Analytic Results.
|
The table presents mean values of precision, sensitivity, and correlation data (MCC) of each algorithm’s ability to correctly classify wear and non-wear compared with volunteers’ wear-time diary data. Temperature differential (diff.) algorithms use temperature difference between internal and external sensors for analysis. (A.) Algorithms which produced the lowest precision, sensitivities, and MCC. (B.) Results of the best algorithms at correctly predicting wear-times. (C.) Results of exclusive combinations of the best sensor/algorithms (all sensors listed are included in analysis) at accurately predicting wear-times. (D.) Results of non-exclusive combinations of the best sensor algorithms (at each time interval, one or two of the sensors listed is not used to determine wear) at correctly predicting wear-times. Abbreviations: MCC, Matthews correlation coefficient; CI, 95% confidence interval; diff., differential; temp., temperature; prox., proximity.