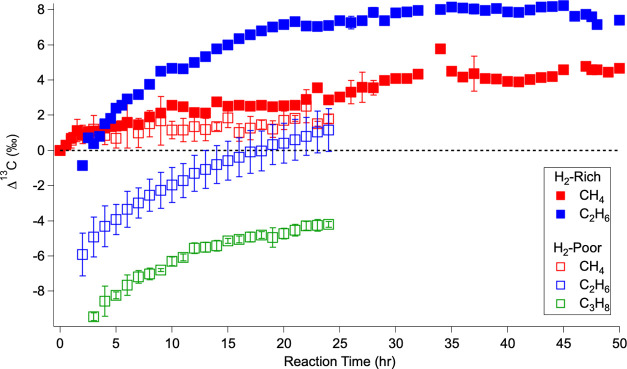
Figure 3.
Temporal evolution of carbon isotope ratios of the sufficiently abundant alkanes over the course of the hydrogen-rich experiments (solid squares) and the hydrogen-poor experiments (open squares). These ratios are presented as Δ13C, which is the difference between the measured δ13C of a given compound at a given time and the δ13C of the initial CH4 for each run (eq 2). Error bars are the standard deviation for the experiments averaged into each time point.

