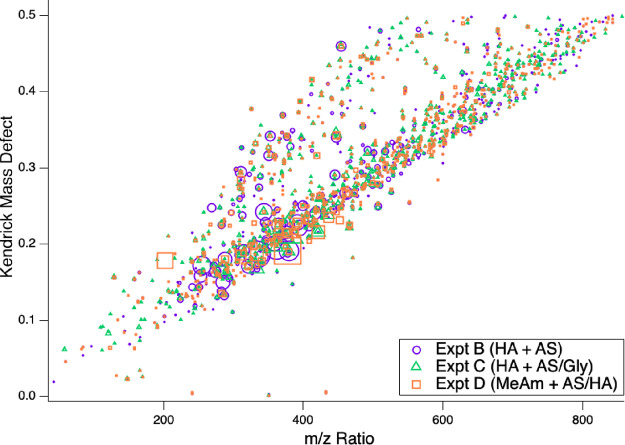
Figure 7.
Kendrick mass defect plot showing differences from unit mass of each peak detected by UHPLC-(+)ESI-HRMS analysis of filter extracts of aerosol collected after Experiments B – D. Colors and symbols indicate whether ions were detected in Experiment B (purple circles), Experiment C (green triangles), and Experiment D (orange squares). Peaks with KMD < 0 are due to inorganic salts.

