FIGURE 1.

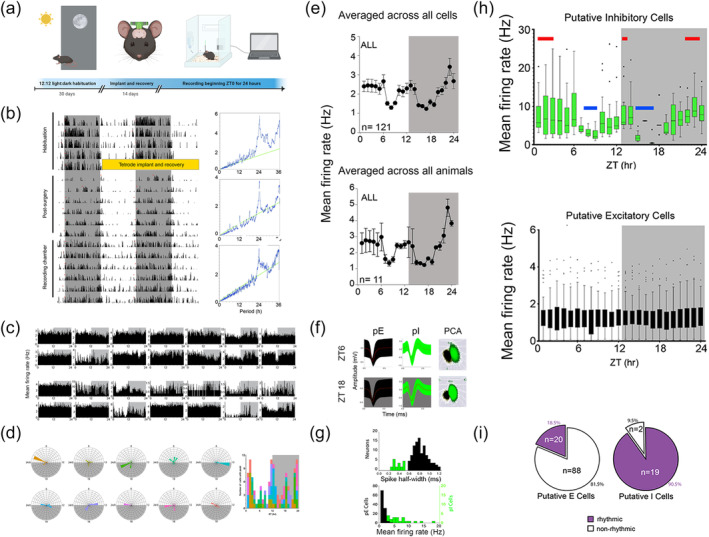
Daily rhythm of hippocampal neuronal firing shows ultradian modulation of inhibitory activity but stable excitatory activity (a) Schematic of experimental setup including habituation, implantation and recording. (b) Locomotor behaviour before implantation, following tetrode craniotomy, recovery and during the recording period: double plotted actigraphy for representative mouse for 30 days. Plotted with 12:12 light: dark cycle with greyed bars indicating dark phase. Periodograms to the right show the daily mouse behaviour period of ~24‐h. (c) Example firing rate plots of all neurons recorded from two individual animals across 24‐h of recording showing variation in individual raster activity. (d) Left: radial plots of the peak firing times of each of the cells for individual animals (each animal is a radial plot and colour). Each tick out from the centre on the radial plot is five neurons. Right: quantification of timings of peak firing for all individual cells (n = 129) (e) Mean firing rate per hour shown averaged across all cells (top)—treating all animals as equal—and then summing firing of all cells within an animal and averaging across animals (bottom, n = 10) (f) Distinguishing units into putative excitatory versus inhibitory subtypes. Recording from one tetrode bundle implanted in dorsal cornu ammonis 1 (CA1). Left: two resulting spike waveforms from the same tetrode at mid‐light and mid‐dark phase (ZT6 and ZT18, respectively). Right: principal component analysis (PCA) profile from the same tetrode, showing location of each action potential in space. Putative excitatory (pE)‐cell action potentials are shown in black and putative inhibitory (pI)‐cell action potentials are shown in green for circadian time shown at left. (g) After selecting for stable units, data across all 24‐h of recording for each cell type (pI‐cells, green and pE‐cells, black) was characterized on two additional metrics: distribution of spike half‐width across cells (top) and overall firing rate distribution of pI‐cells (n = 21) and p‐I cells (n = 108). (h) Average firing rate per hour for 24‐h recordings starting at ZT0 for pI‐cells (green, top). Red bars indicate peaks above the 24‐h mean based on pairwise multiple comparisons (ZT1–3, Z12–13 and ZT21–23). Blue bars indicate significant troughs (ZT8–9 and ZT15–17). Graph is box and whisker with outliers shown as black dots. Background shading indicates the 12:12 light/dark schedule: grey for dark. Average firing rate per hour for pE‐cells (black) did not reveal any hours significantly differing from the 24‐h mean. (i) Pie chart indicating the number of arrhythmic (white) and rhythmic (purple) cells for each of pE‐cells (18.5%) and pI‐cells (90.4%) as assessed by cosinor analysis (see Section 2). Statistical analysis with Fisher's exact test.
