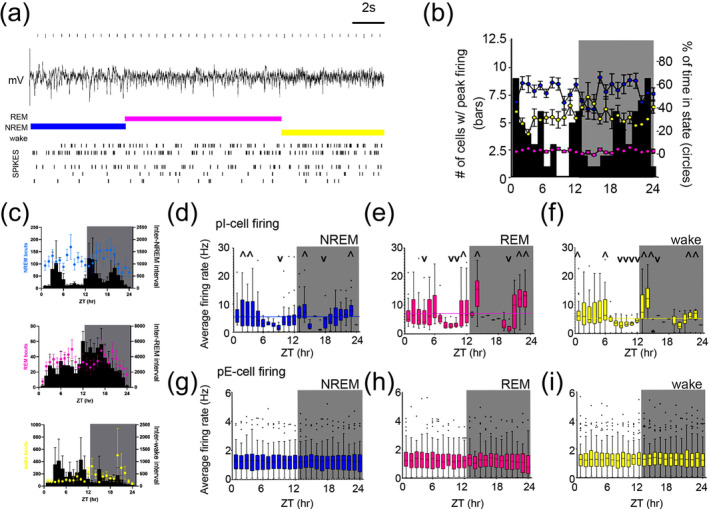
FIGURE 2.

Stable excitatory signalling persists independent of sleep state, while p‐I firing dynamics anticipate light change (a) Sleep was characterized using combined behavioural and local field potential (LFP) data. Example spike raster for one animal shown for 40 s. Coloured bars above traces indicate assigned state: wake (yellow), non‐rapid eye movement (NREM) (blue) and rapid eye movement (REM) (pink). (b) Sleep state does not dictate timing of peak firing rate for all neurons. Connected coloured dots on each plot are the percent occupancy (right axis) of each state. Black bars: the number of total neurons (out of n = 129) having peak firing rate in that hour (left axis). (c) Mean bout length (in seconds) plotted as mean across animals (coloured dots, representative of sleep states) and inter‐state intervals for each state type (black bars). (d–f) Average firing rate per hour of putative inhibitory (pI)‐cells shows significant differences across the day when analysing only data within each sleep/wake state. Individual hourly statistics are highlighted with symbols ^ and v representing values above or below the mean, respectively, for each state. Means for each state are NREM = 5.106 Hz, REM = 7.012 Hz and wake = 5.446 Hz, each annotated in graph as coloured horizontal line (complete statistics in Table S1). As an effect of zeitgeber time (ZT), regardless of state, there is variability of pI‐cell firing across time, p < 0.001, NREM (d), p < 0.001 for REM (e) and p < 0.001 for wake (f), one‐way ANOVA. Graphs are box and whisker plots with line representing mean and with Tukey analysis. Outliers are shown as black dots. Background shows light/dark lighting. (g–i) Average firing rate per hour of putative excitatory (pE)‐cells shows stable firing independent of both ZT and sleep‐state. Graphs and statistics as shown same as in (d–f).
