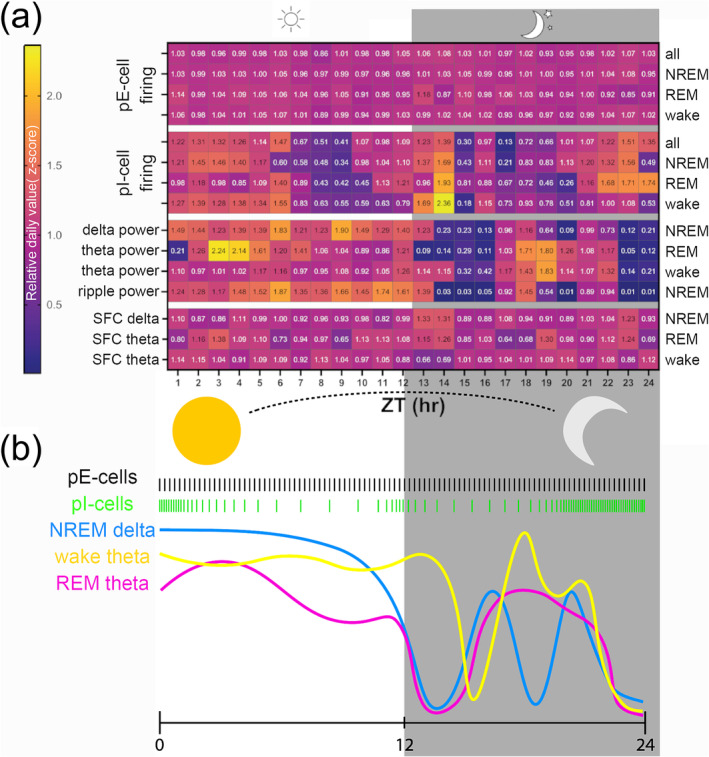
FIGURE 4.

Summary of normalized time‐of‐day effects on different electrophysiologic background signatures (EBSs). (a) Normalized values per each metric across the day are plotted in hour bins (n = 10 mice). Values are z‐scores per each animal for each feature, averaged across all animals. Left labels denote type of EBS analysis: putative excitatory (pE)‐ and putative inhibitory (pI)‐cell firing rates, local field potential (LFP) powers and spike‐field coherence (SFC). Sleep states labelled at right are shown as individual rows. Evident is pE stability (top rows) which contrasts with pI‐cell variance that includes peaks around zeitgeber time (ZT) hours 24/0 and troughs around hours 9 and 14–15 across all sleep states. For LFP level changes, non‐rapid eye movement (NREM) and rapid eye movement (REM) sleep generally show light‐hours (inactive time) enrichment of oscillatory power, with secondary peak around ZT18, in the middle of the animals' active period. Waking theta remains elevated across the light period, before dropping after lights off, but also shows peak at ZT19. (b) Visual depiction of the z‐scores presented in (a). The pE‐ and pI‐cell firing rates are shown graphically in black and green, respectively. The continuous LFP are shown with blue, yellow and pink coloured lines for NREM‐delta and REM and wake theta, respectively, as shown in Figure 3.
