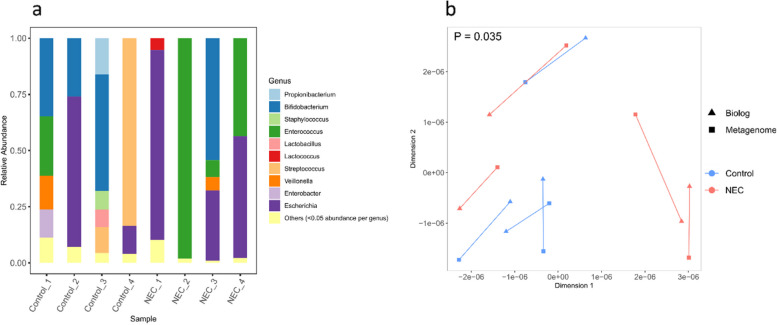
Fig. 2.
Comparison of Biolog functional activity with microbiome profiles from the same stool samples. Analysis includes a subset of eight samples (four NEC and four controls) for which metagenome data was available. a Stacked bar plots of microbiota composition at the genus level. Samples names with the same number are matched NEC-Control pairs. Genera with a relative abundance < 0.05 are pooled into the “Others” category. b Ordination plot showing outcome of Generalised Procrustes Analysis (GPA) comparing taxonomic data at the genus level with data generated from Biolog assays for the same subset of eight samples as in (a)

