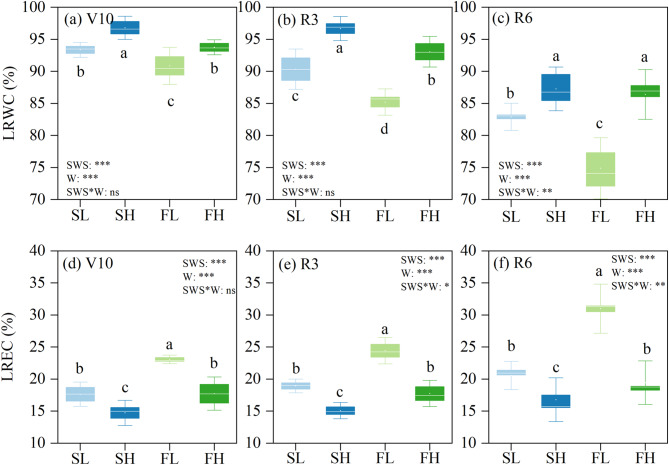
Fig. 3.
Dynamic changes in leaf relative water content (LRWC) and relative electrical conductivity (LREC) of maize plants. Values are the mean ± SD (n = 4–5). Duncan’s multiple-range test was used to test differences among treatments at the P < 0.05 level. Different lowercase letters above the columns indicate significant differences among treatments at the same stage. SL: stable soil water with 55% FC, SH: stable soil water with 75% FC, FL: fluctuating soil water with 55% FC, FH: fluctuating soil water with 75% FC, V10: ten-leaf stage, R3: milk stage, R6: physiological maturity stage, SWS: soil water stability, W: soil water content, SWS*W: the interaction between soil water stability and soil water content. *, **, and *** indicate significance levels at P < 0.05, P < 0.01, and P < 0.001, respectively, and ns indicates that the difference is not significant

