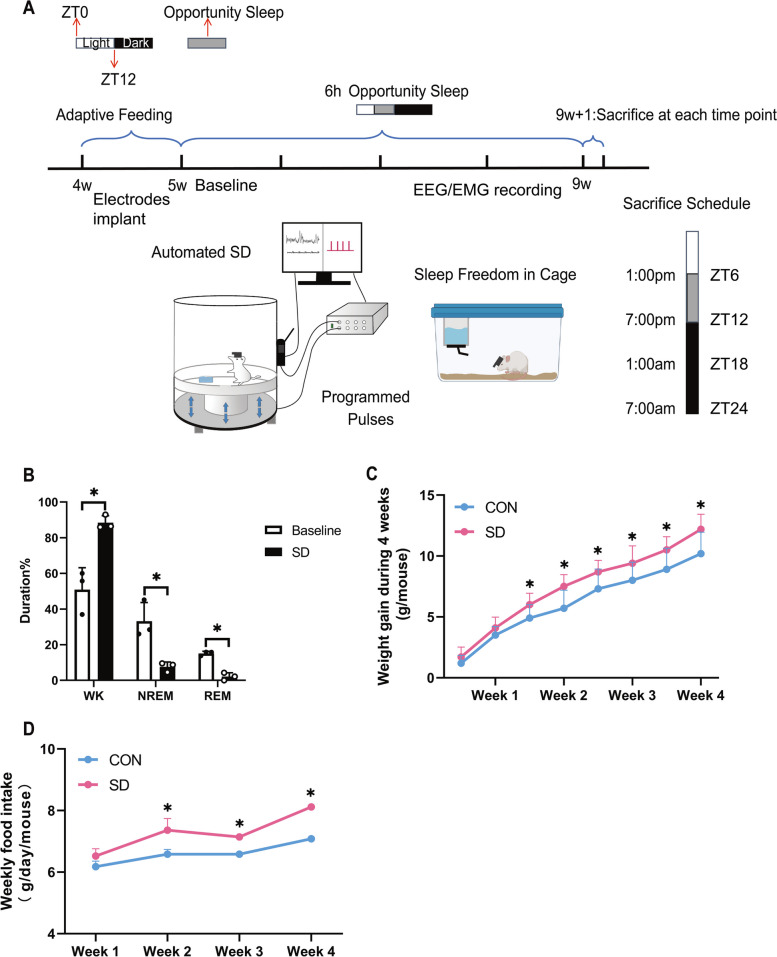
Fig. 1.
Chronic sleep deprivation-induced aberrant feeding behavior. A Experimental design and timeline. B Changes of different sleep stages duration after sleep deprivation for 4 weeks (n = 3) and presented as bar graphs. EEG data were recorded on the last sleep deprivation day. Significant difference (single asterisk) was defined as p < 0.05 by a two-sided unpaired t-test. C Line chart, weekly body weight gain during chronic sleep deprivation (n = 10). Significant difference (single asterisk) was defined as p < 0.05 by two-way repeated-measures ANOVA and pairwise comparisons. D Line chart, weekly food intake during chronic sleep deprivation (n = 12, 3 mice per cage for distribution). Significant difference (single asterisk) was defined as p < 0.05 by two-way repeated-measures ANOVA and pairwise comparisons. Data were represented as means + standard deviations for B, C, and D. Data were presented as the means ± standard deviations. NREM, non-rapid eye movement; REM, rapid eye moment; SD, sleep deprivation group, mice received 4 weeks of sleep deprivation (18 h/day); CON, control group. ZT, Zeitgeber time

