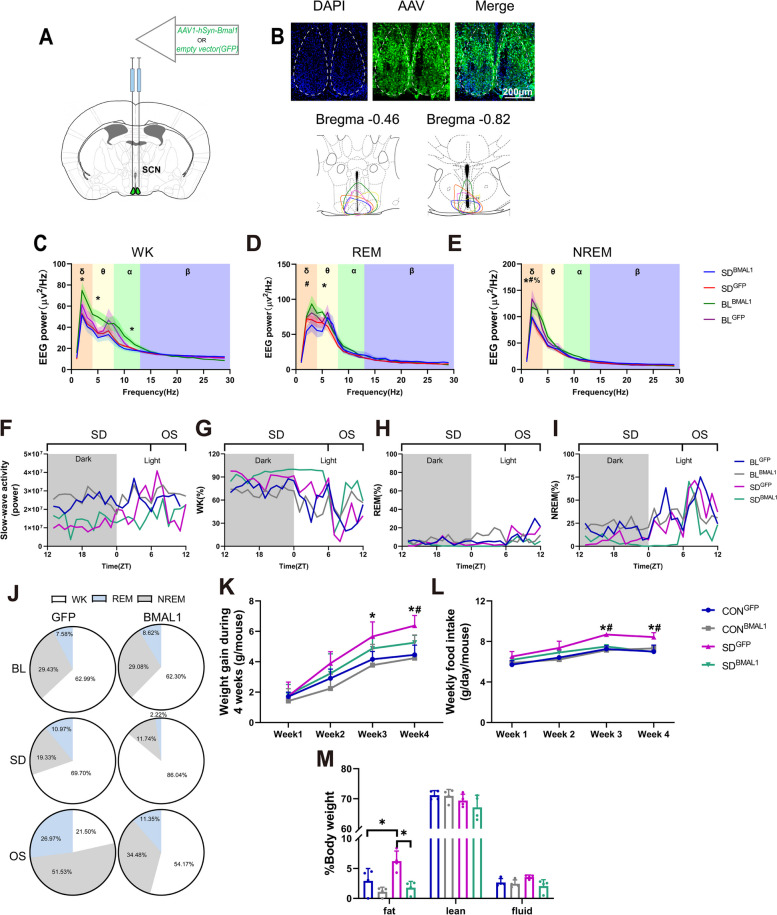
Fig. 5.
Chronic sleep deprivation changed sleep behavior. A Viral injection, empty vector/AAV1-hSyn-Bmal1 was injected at the shell of SCN bilaterally in the mice. B Schematic timeline. C Representative images showing GFP, DAPI, and merged images in the SCN, and schematic showing dissection neurons. D–F. EEG power during wakefulness (WK), rapid eye movement (REM), and non-rapid eye movement (NREM) (n = 4 for BLGFP, n = 5 for BLBMAL1, n = 6 for SDGFP and SDBMAL1). Single asterisk, BLBMAL1 vs. SDBMAL1 p < 0.05; percent, BLGFP vs. SDGFP p < 0.05; number sign, SDGFP vs. SDBMAL1 p < 0.05 by one-way ANOVA. G A representative 24-h recording of slow-wave activity (SWA), and SWA is plotted as the power of the mean activity during NREM over 24 h. H–J Representative hourly amounts of sleep during a constant 24-h. K Representative pie chart for sleep distribution during 24-h baseline (BL), 18-h sleep deprivation (SD), and 6-h opportunity sleep (OS). L Weight gain during 4 weeks of sleep deprivation (18 h/day) (n = 8). Single asterisk was defined as p < 0.05 by two-way repeated-measures ANOVA with Tukey’s post hoc test. Data were represented as means + standard deviations for L, M, and N. M Weekly food intake during 4 weeks of sleep deprivation (18 h/day) (n = 8, 2 or 3 mice per cage for distribution). Single asterisk was defined as p < 0.05 by two-way repeated-measures ANOVA with Tukey’s post hoc test. N Body composition after chronic sleep deprivation (n = 4). BLGFP, mice received injection of AAV-GFP before sleep deprivation; BLBMAL1, mice received injection of AAV-BMAL1 before sleep deprivation; CONGFP, the control group with empty vector; CONBMAL1, the control group with AAV-genetic overexpression of BMAL1; SDGFP, the chronic SD group with empty vector; SD.BMAL1, the chronic SD with AAV-genetic overexpression of BMAL1

