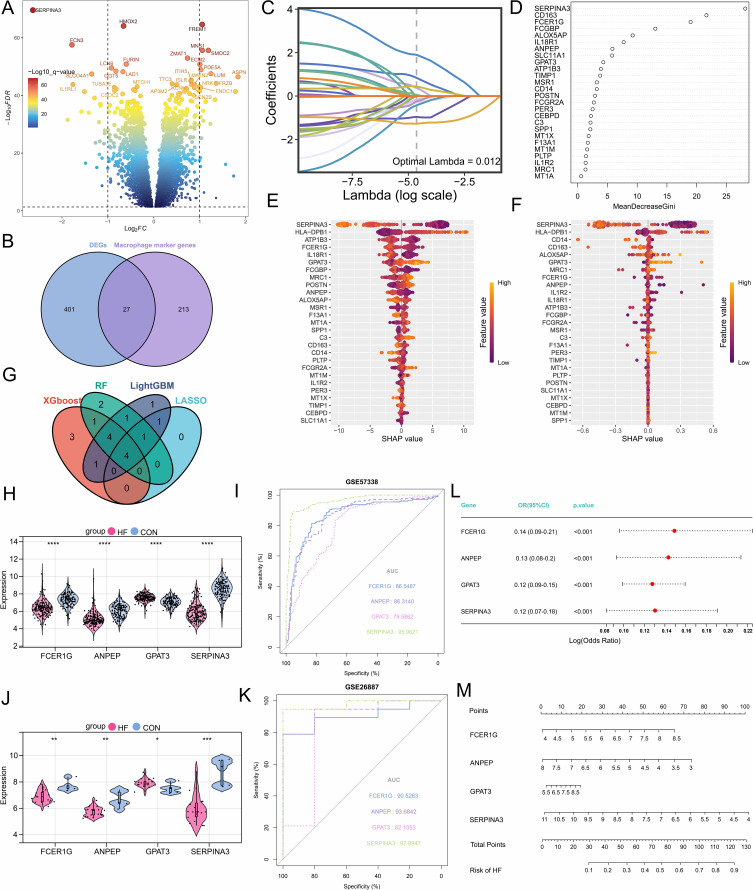
Figure 3.
Selection, validation of signature genes, and construction of the diagnostic model. (A) Volcano plot of differentially expressed genes. (B) The Venn diagram shows the differentially expressed macrophage-related genes. (C) Feature genes were selected using the LASSO algorithm with λ = 0.012. (D) The RF algorithm ranks the importance of 27 differentially expressed genes. (E) SHAP dependency analysis based on the XGBoost model describes the importance of individual feature variables in the predictive model. (F) SHAP dependency analysis based on the LightGBM model describes the importance of individual feature variables in the predictive model. (G) Hub genes with diagnostic value were identified through the intersection of multiple machine learning algorithms. (H and I) Expression levels of hub genes and evaluation of the diagnostic model in the GSE57338 dataset. (J and K) Expression levels of hub genes and evaluation of the diagnostic model in the GSE26887 dataset. (L) Multivariable logistic regression analysis. (M) The nomogram evaluates the total risk score for developing heart failure. *, P<0.05; **, P<0.01; ***, P<0.001; ****, P<0.0001.

