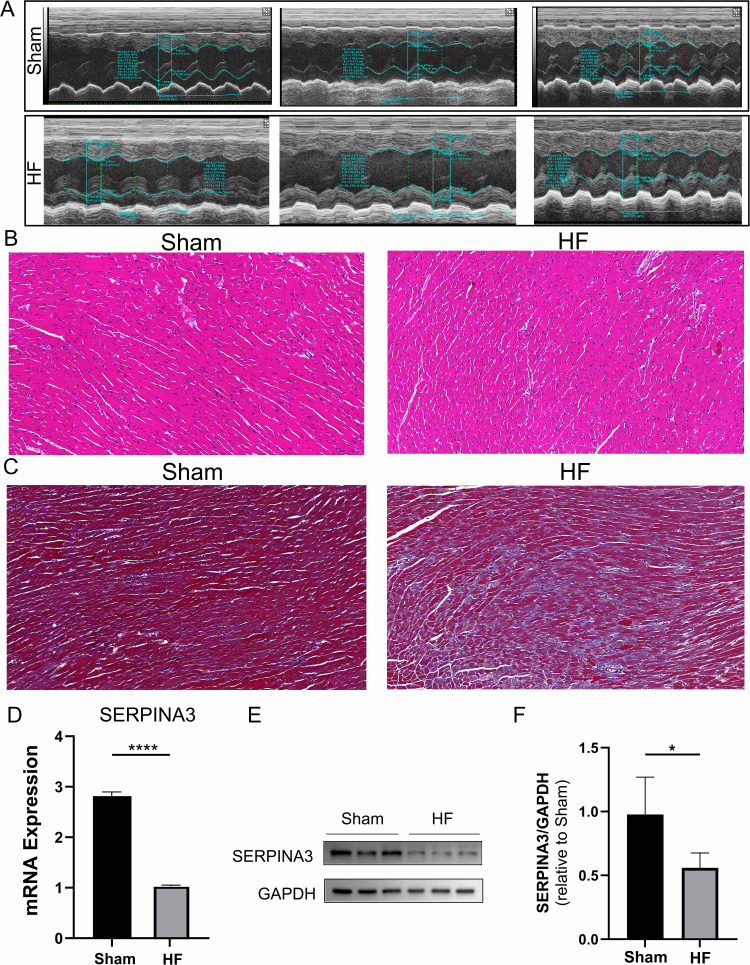
Figure 4.
Construction of TAC-induced heart failure mouse model and experiments. (A) Echocardiography of the mouse model. (B) HE staining of rat myocardial tissue. Scale bar: 20 μm; original magnification, ×20. (C) Masson staining shows higher fibrosis levels in the HF group compared to the sham group. Scale bar: 20 μm; original magnification, ×40. (D) q-PCR validation of SERPINA3 expression at the mRNA level. (E and F) Western blot bands and histograms of SERPINA3 protein expression in myocardial tissue. *, P < 0.05; ****, P < 0.0001.

