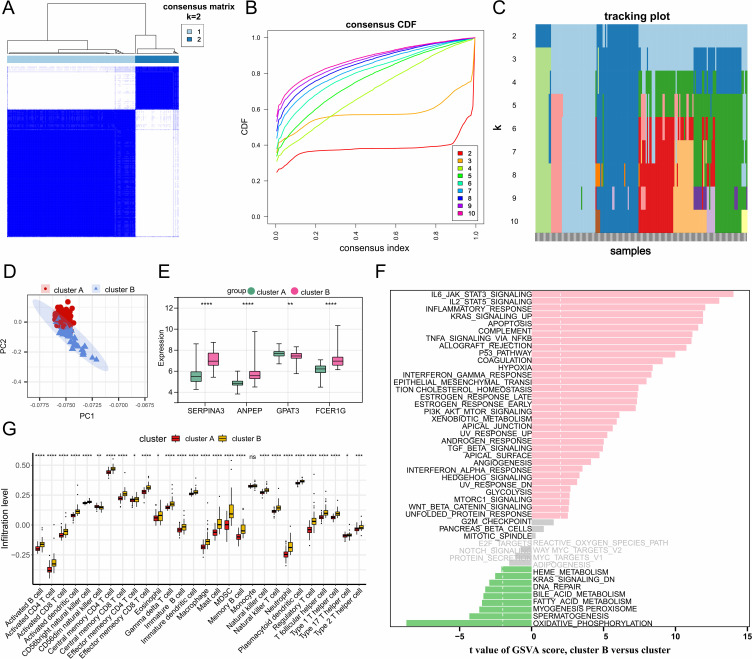
Figure 5.
Identification of macrophage-related gene expression patterns in heart failure. (A–C) Unsupervised clustering analysis based on the expression profile data of 27 macrophage-related genes. When K=2, heart failure samples can be clearly clustered into two subtypes. (D) PCA reveals the clustering trend of the two subgroups in HF samples. (E) Bar chart showing the expression changes of hub genes in the two subgroups. (F) GSVA enrichment analysis results based on the Hallmark gene sets from the MSigDB database. (G) Differences in immune cell infiltration between the two subgroups. *, P<0.05; **, P<0.01; ***, P<0.001; ****, P<0.0001.

