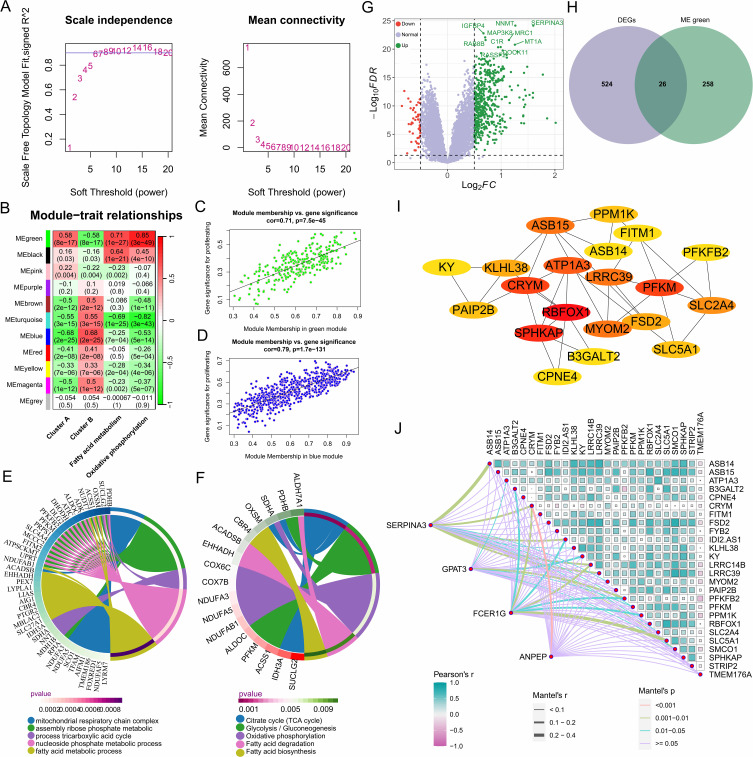
Figure 6.
Identification of metabolic hub genes in heart failure based on WGCNA analysis. (A) Selection of 6 as the appropriate soft threshold based on the scale-free topology fitting index, which provides optimal network connectivity. (B) Correlation between module and trait. The redder the color, the higher the positive correlation between the module and the trait; the greener the color, the higher the negative correlation. (C and D) Correlation between the green and blue modules and the trait. (E) Biological processes involved by genes in the green module. (F) Signaling pathways involved by genes in the green module. (G) Volcano plot showing differentially expressed genes between the two clusters. (H) Differentially expressed genes related to fatty acid metabolism and oxidative phosphorylation. (I) Protein-protein interaction network of differentially expressed metabolic-related genes between the two clusters. (J) Correlation between diagnostic markers in cluster A and metabolic-related genes.

