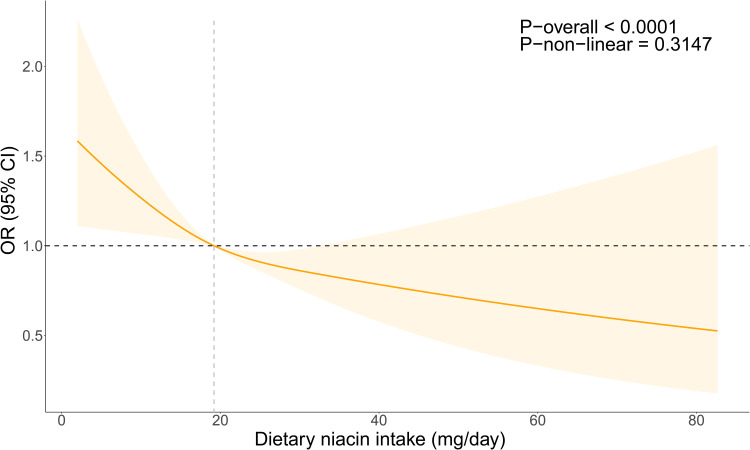
Figure 2.
OR of dietary niacin intake concerning RA adjusted for covariates in NHANES 2003–2016 The RCS line is adjusted for various factors including age, race, PIR, education, BMI, alcohol consumption, smoking, diabetes, hypertension, white blood cell count, red blood cell count, mean platelet volume, and systemic immune-inflammatory index. The OR is visualized by the Orange line, and the shaded region signifies the 95% CI.
Abbreviations: OR, Odds Ratio; CI, Confidence Interval.

