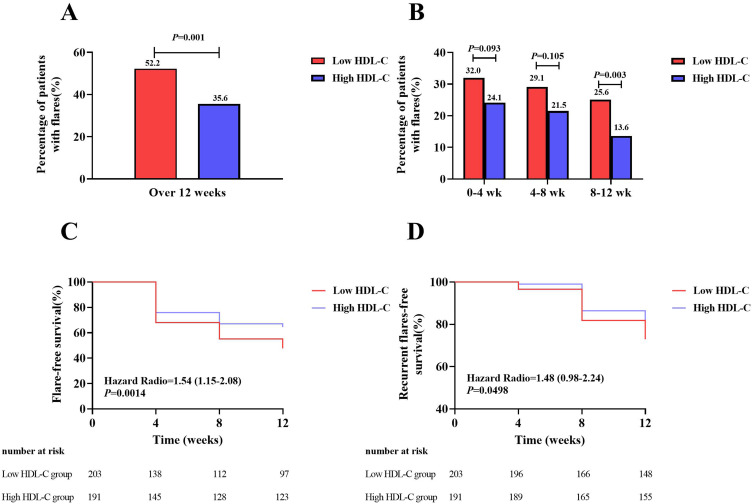
Figure 2.
Gout flares in the low and high HDL-C group over the 12 weeks follow-up. (A) Comparison of percentage of patients with gout flares between the low and high HDL-C group over 12 weeks. (B) Comparison of percentage of patients with gout flares between the low and high HDL-C group every 4 weeks. (C) Comparison of percentage of patients without gout flare between the low and high HDL-C group during the follow-up. (D) Comparison of percentage of patients without recurrent gout flares between the low and high HDL-C group during the follow-up. HDL-C, high-density lipoprotein cholesterol.

