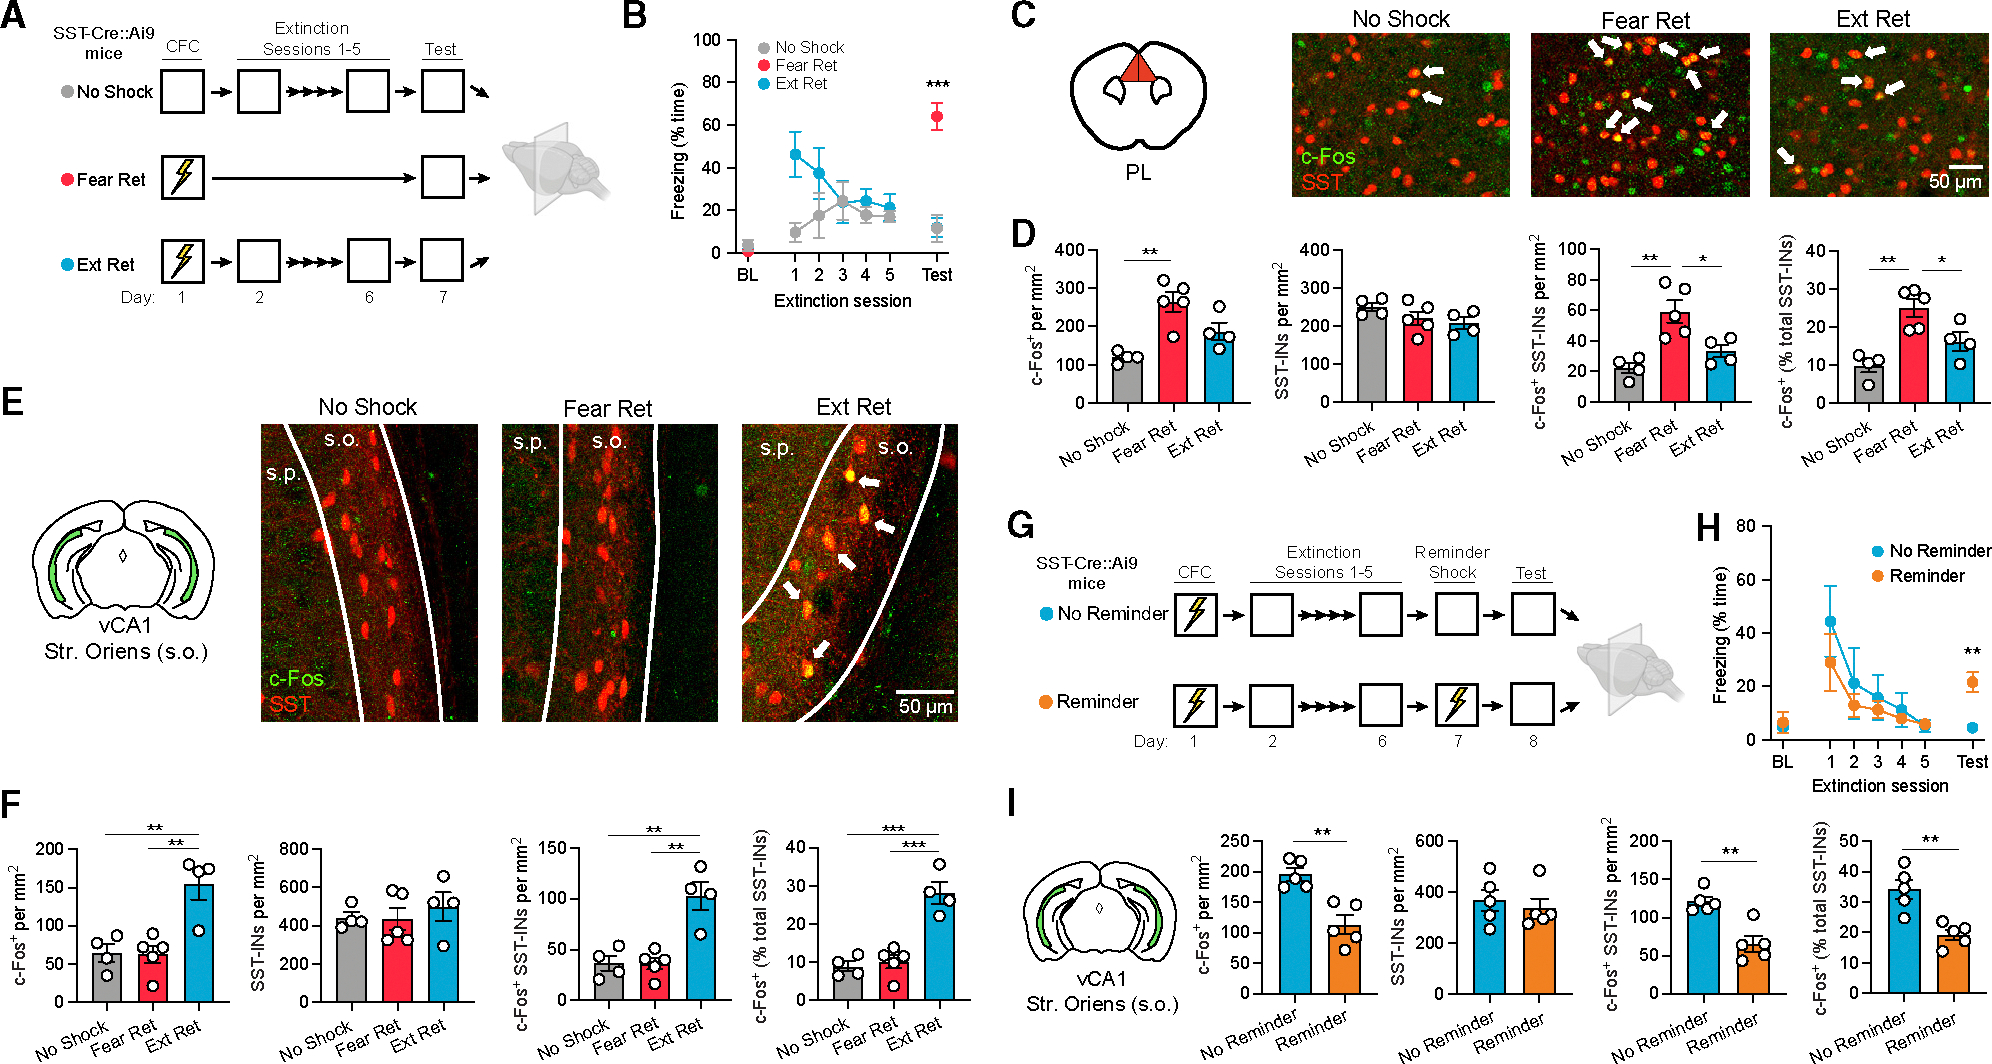
Figure 1. Extinction modulates context-evoked activity of prelimbic and vCA1 SST-Ins.

(A) Design for analysis of c-Fos expression following retrieval of contextual fear extinction (Ext Ret) as compared to control subjects for which either foot shocks (No Shock) or extinction (Fear Ret) were omitted. Contextual fear conditioning (CFC) consisted of three 2 s, 0.75 mA shocks, and extinction consisted of 10 min of context exposure daily for 5 days. Brains were collected for immunohistochemical analysis 90 min following a final context test (5 min). All mice were SST-Cre::Ai9.
(B) Freezing across extinction and test sessions. BL, preconditioning baseline. Freezing during test: F(2, 10) = 26.8, p < 0.0001, one-way ANOVA.
(C) c-Fos (red) and SST-IN (green) labeling for the PL. Arrows denote co-labeled cells.
(D) Group comparisons of prelimbic cell counts by one-way ANOVA. c-Fos+ cell density: F (2, 10) = 11.8, p < 0.01. c-Fos+ SST-IN density: F (2, 10) = 11.4, p < 0.01. c-Fos+ SST-INs (% total SST-INs): F (2, 10) = 12.3, p < 0.01.
(E) c-Fos and SST labeling for the vCA1 stratum oriens (s.o.). Arrows denote co-labeled cells.
(F) Group comparisons of vCA1 s.o. cell counts by one-way ANOVA. c-Fos+ cell density: F (2, 10) = 11.11, p < 0.01. c-Fos+ SST-IN density: F (2, 10) = 14.17, p < 0.01. c-Fos+ SST-INs (% total SST-INs): F (2, 10) = 27.10, p < 0.0001.
(G) Design for analysis of c-Fos expression following reminder shock-induced relapse. Subjects were treated identically throughout CFC and extinction, except one group was exposed to a single reminder shock prior to the test (Reminder).
(H) Freezing across extinction and test sessions. Freezing during test: t (8) = 4.27, p < 0.01.
(I) Group comparisons of vCA1 s.o. immunohistochemical cell counts by unpaired t test. c-Fos+ cell density: t (8) = 4.50, p < 0.01. c-Fos+ SST-IN density: t (8) = 4.58, p < 0.01. c-Fos+ SST-INs (% total SST-INs): t(8) = 4.17, p < 0.01.
(A–F) No Shock: n = 4; Fear Ret: n = 5; Ext Ret: n = 4.
(G–I) Ext Ret: n = 5; Reminder: n = 5.
*p < 0.05, **p < 0.01, ***p < 0.001 by Tukey’s post hoc test (B, D, and F) or unpaired t test (H and I). Error bars indicate standard error of mean.
