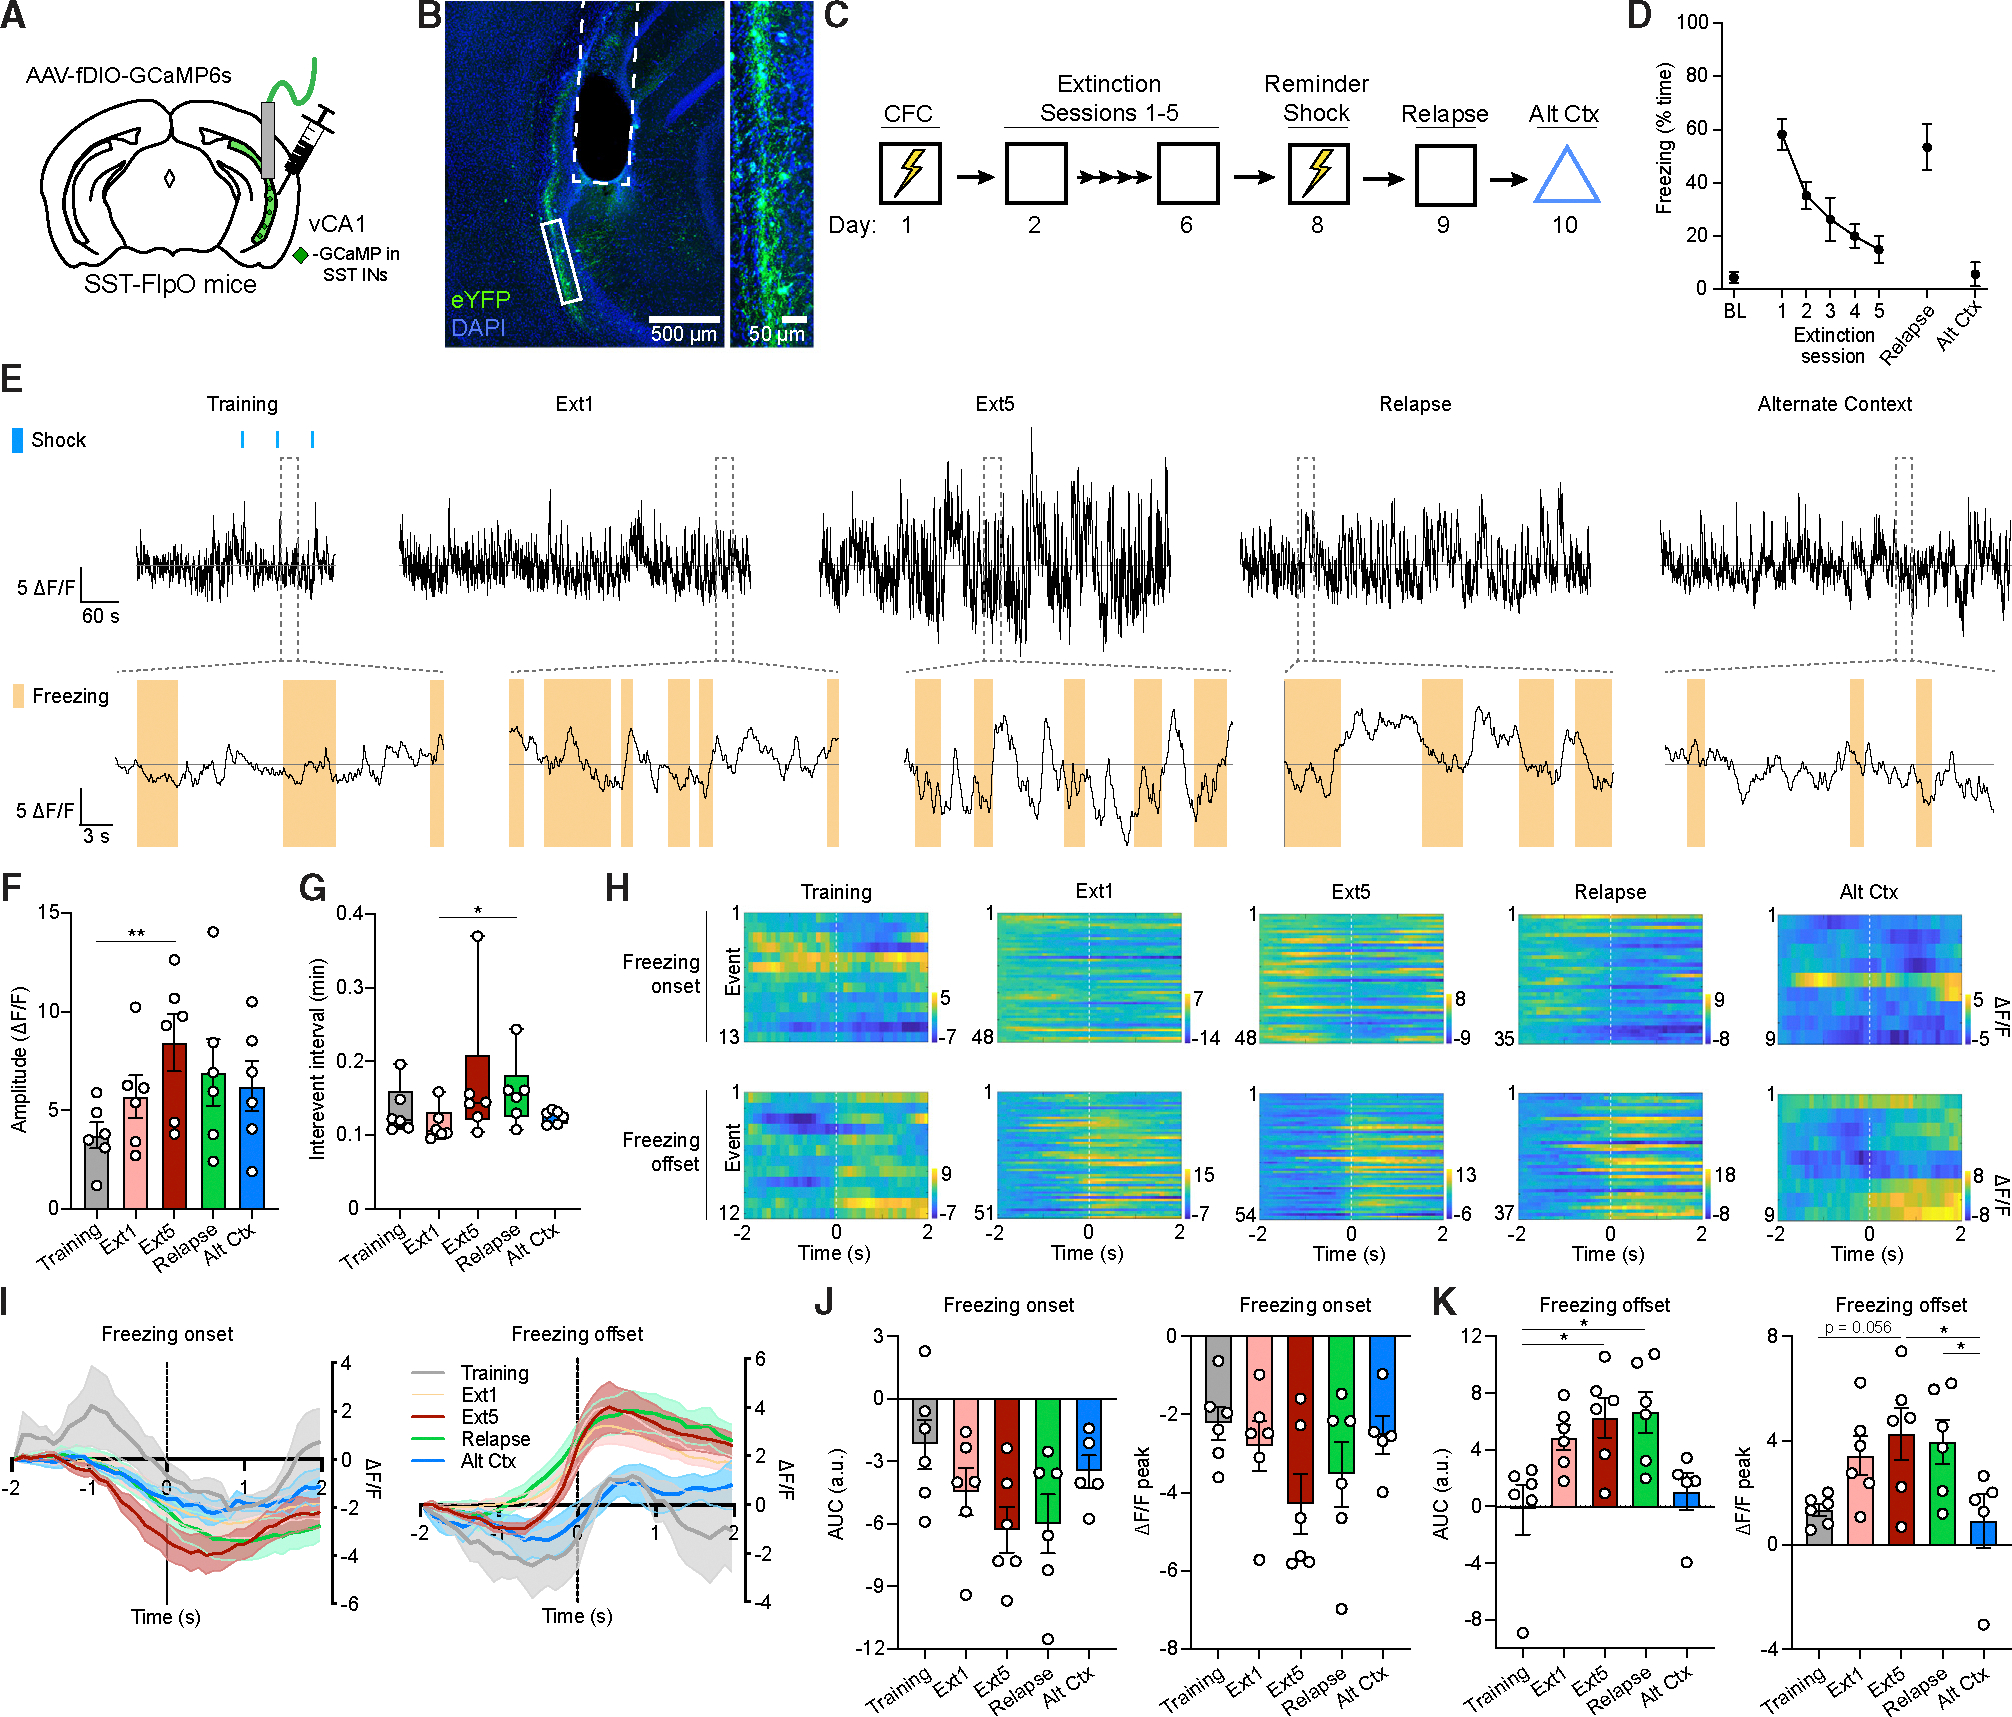
Figure 3. In vivo vCA1 SST-IN activity is organized around freezing bouts and amplified by extinction.

(A) Strategy for fiber photometry recordings in vCA1 SST-INs in SST-FlpO mice.
(B) Representative image of GCaMP6s viral expression and optic fiber placement (dashed white line). A solid white box indicates the area of magnification (right).
(C) Design for fiber photometry recording across CFC, extinction, reminder shock-induced relapse, and alternate context exposure.
(D) Freezing during preconditioning BL, extinction sessions, relapse, and alternate context tests.
(E) Top row: representative whole session normalized Ca2+ activity (reported as ΔF/F) from vCA1 SST-INs. Blue boxes indicate foot shocks during training. Bottom row: expanded calcium traces from areas highlighted by dashed gray boxes, with freezing bouts ≥1 s indicated by orange boxes.
(F) Whole-session analysis of peak Ca2+ event amplitude (ΔF/F) by one-way repeated measures ANOVA. F (4, 20) = 4.60, p < 0.01.
(G) Whole-session analysis of interevent interval by Friedman test. χ2 = 9.85, p < 0.05.
(H) Representative peri-event time heatmaps (PETH) of Ca2+ activity (ΔF/F) across sessions of ±2 s from freezing onset (top row) and freezing offset (bottom row) events.
(I) Mean ΔF/F across sessions of ±2 s from freezing onset (left) and freezing offset (right) events.
(J and K) Quantification of area under the curve (AUC) (left) and peak amplitude (right) of mean ΔF/F across sessions of 0–2 s from freezing onset (J) and freezing offset (K) events, as analyzed by mixed-effects model analysis. Freezing offset AUC: F (4, 19) = 5.43, p < 0.01. Freezing offset peak: F (4, 19) = 4.89, p < 0.01. n = 6; one mouse did not have any freezing bouts that met inclusion criteria for PETH analysis in the Alt Ctx test, and thus a mixed-effects model was used to handle this omission.
*p < 0.05, **p < 0.01 by Tukey’s post hoc test (F, J, and K) or Dunn’s post hoc test (G). Error bars indicate standard error of mean.
