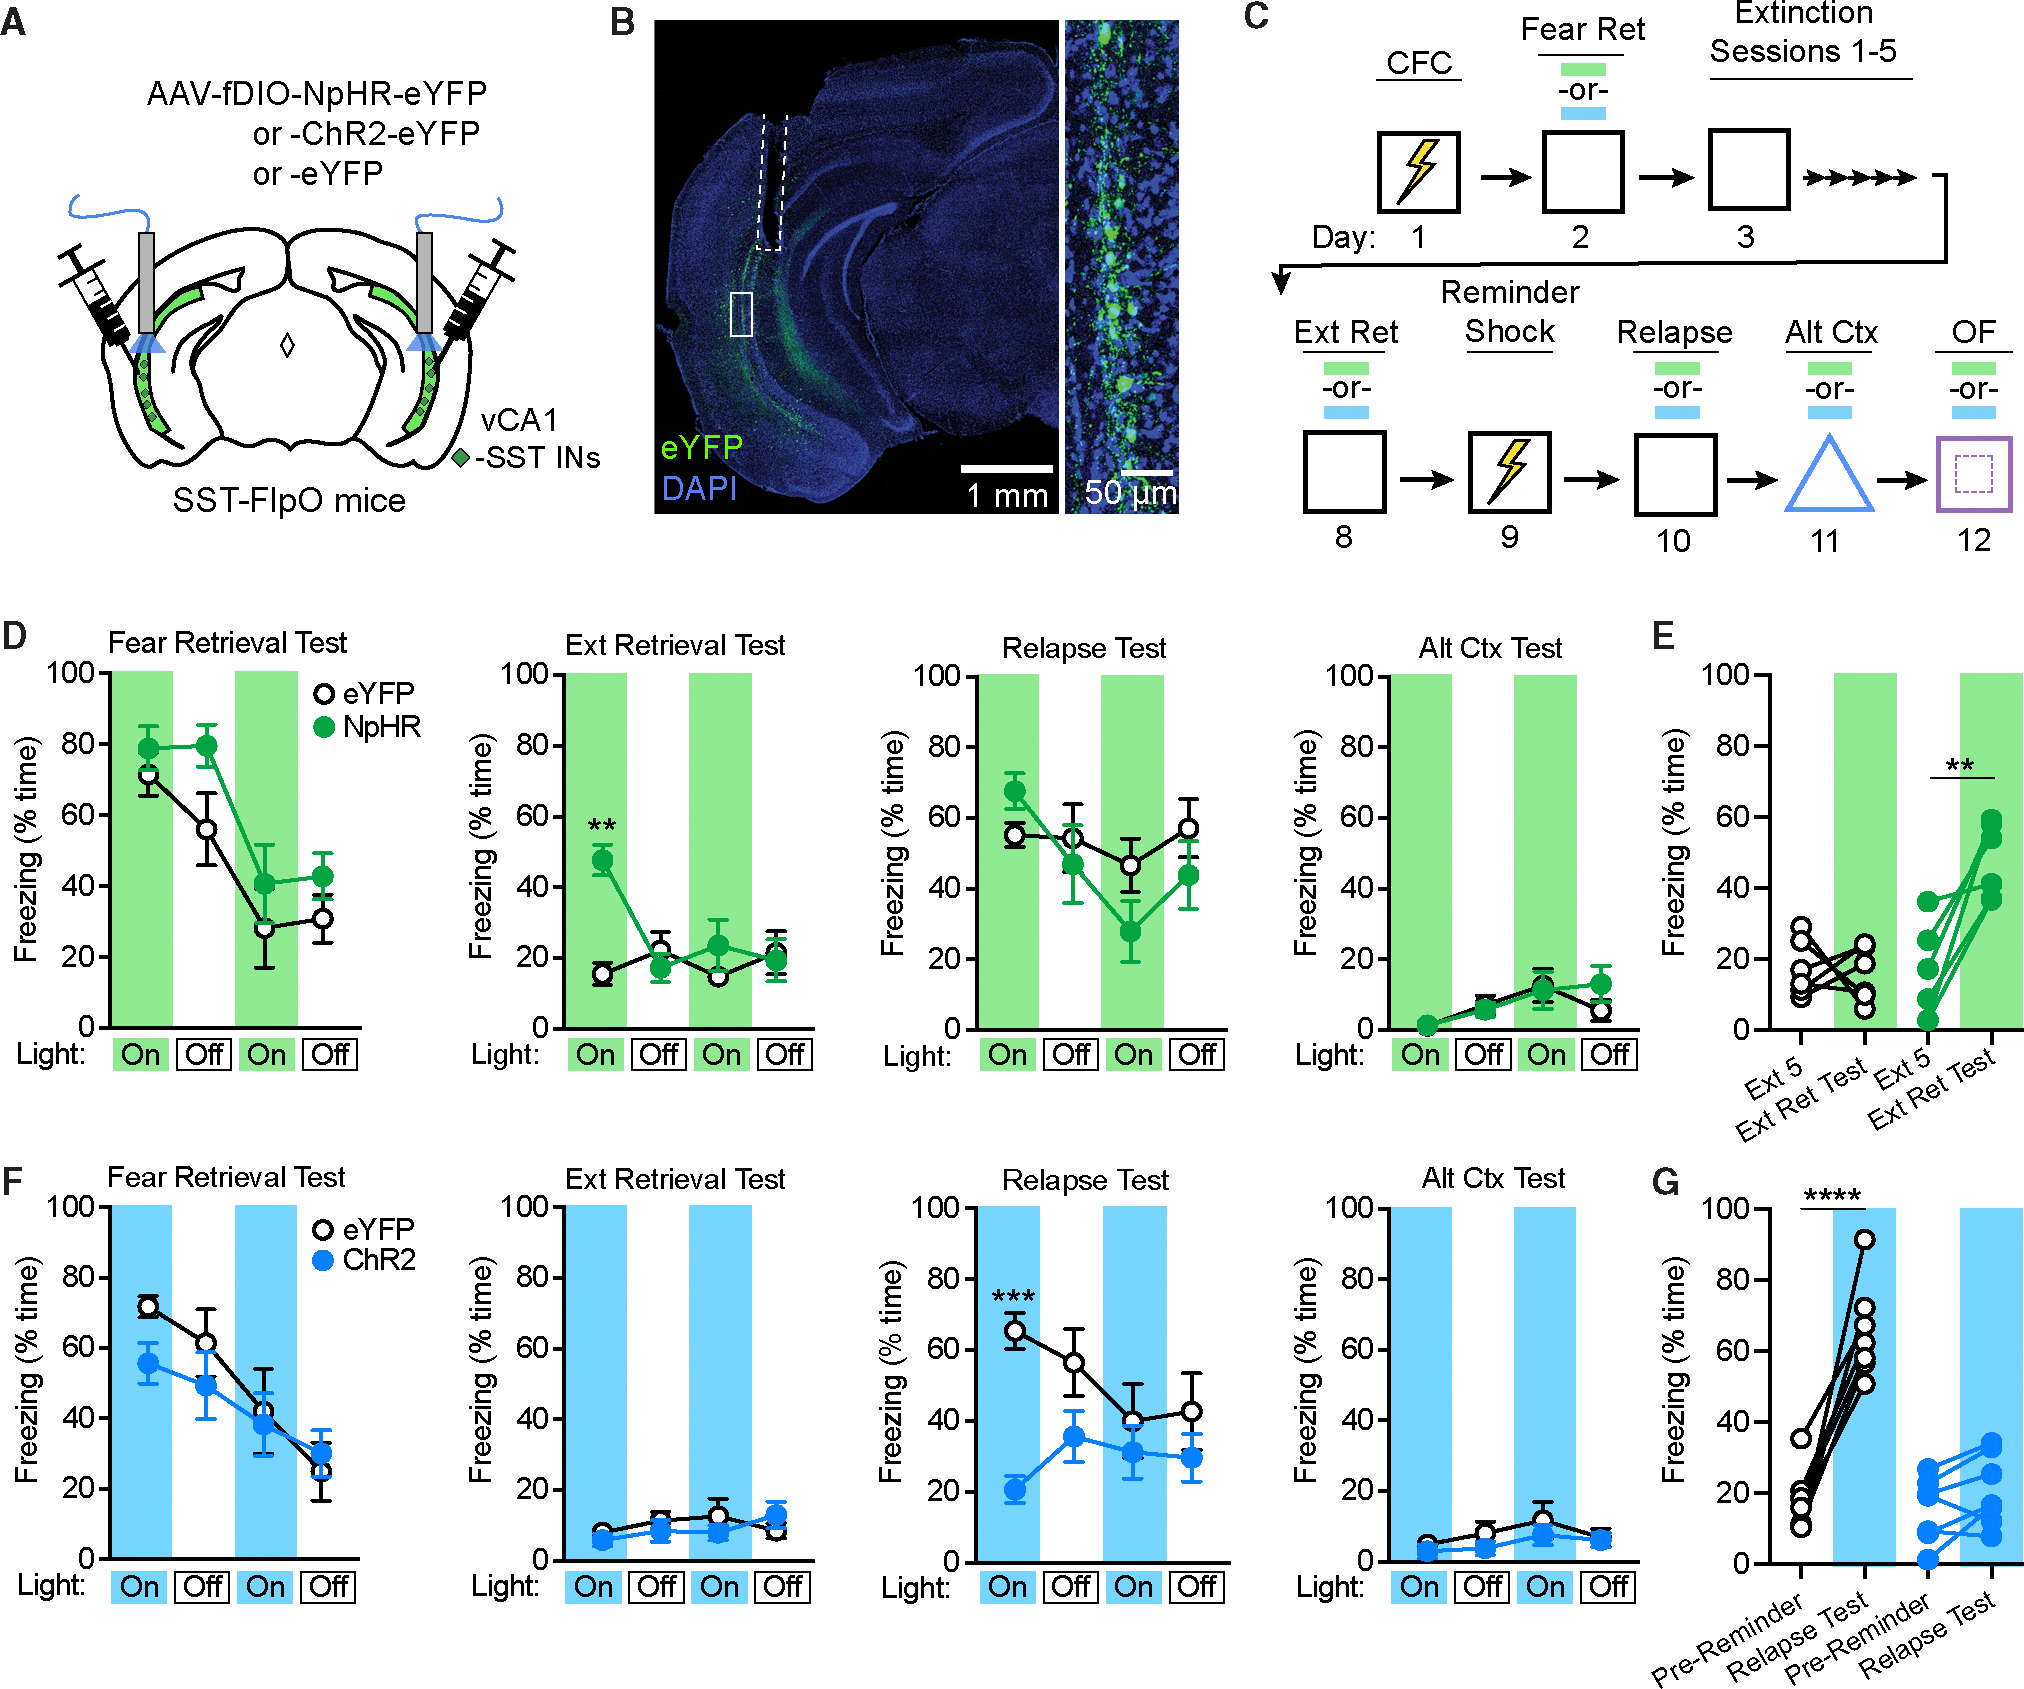
Figure 4. Manipulation of SST-IN activity alters freezing to the conditioned context following extinction.

(A) Strategy for targeting of vCA1 SST-INs for optogenetic manipulations with halorhodopsin (NpHR), channelrhodopsin-2 (ChR2), or opsin-negative controlvectors (eYFP only) in SST-FlpO mice.
(B) Representative image of resulting viral expression and optic fiber placement (dashed white line). A solid white box indicates the area of magnification (right).
(C) Design for CFC, extinction, reminder shock-induced relapse, and alternate context exposure with photostimulation tests at the indicated time points (blue and green bars). OF, open field test.
(D) Effect of NpHR-mediated photoinhibition during fear retrieval, extinction retrieval, relapse, and alternate context tests, as analyzed by two-way repeated-measures ANOVA across all light-on and light-off epochs (3 min duration), of which there were two light-on and light-off epochs per session. Opsin 3 epoch interaction: F (15, 150) = 2.40, p < 0.01.
(E) Change in freezing between the first 3 min of the final extinction session (Ext 5) and the first light-on epoch of the extinction retrieval test (Ext Ret Test), as analyzed by two-way repeated measures ANOVA. Opsin × test interaction: F (1, 10) = 11.1, p < 0.01.
(F) Effect of ChR2-mediated photoexcitation during similar tests as in (D), as analyzed by two-way repeated-measures ANOVA across all light-on and light-offepochs. Opsin × epoch interaction: F (15, 180) = 3.01, p < 0.001.
(G) Change in freezing between the pre-reminder shock BL period and first light-on epoch of the relapse test. Opsin × test interaction: F (1, 12) = 35.7, p < 0.0001. eYFP for NpHR experiment: n = 6; NpHR: n = 6; eYFP for ChR2 experiment: n = 7; ChR2: n = 7.
**p < 0.01, ***p < 0.001 by Tukey’s post hoc test (D and F) or Šídák’s post hoc test (E and G). Error bars indicate standard error of mean.
