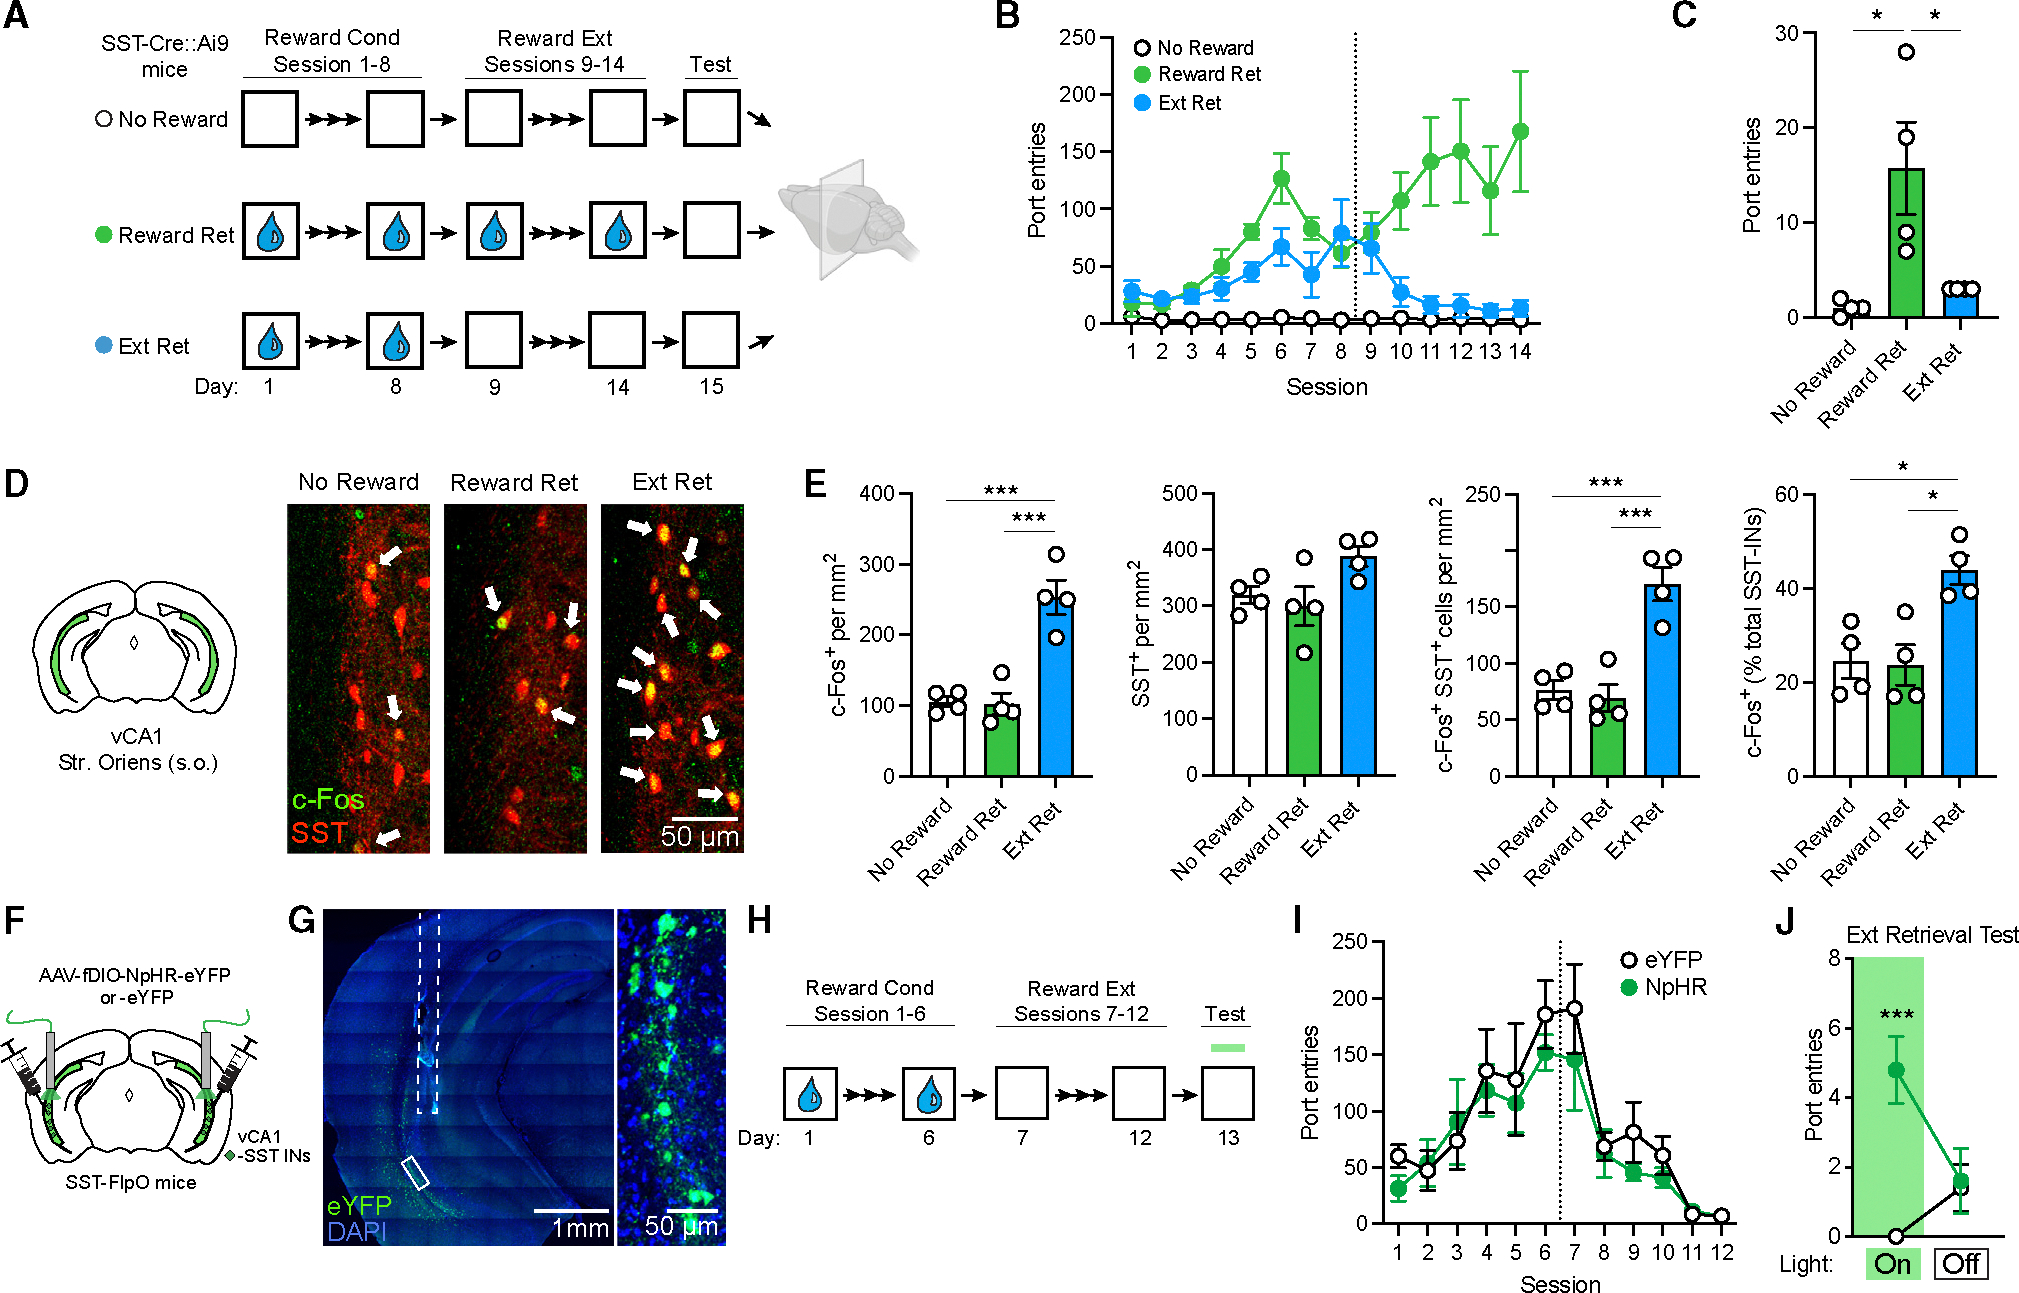
Figure 7. Extinction retrieval after appetitive conditioning depends on vCA1 SST-IN activity.

(A) Design for analysis of c-Fos expression following retrieval of contextual reward extinction (Ext Ret) as compared to control subjects for which either sucrose reward (No Reward) or extinction (Reward Ret) were omitted. Appetitive conditioning consisted of unsignaled delivery of 30% sucrose to a reward port 30 times a session at a variable interval (with total session length of ~30 min). Brains were collected for immunohistochemical analysis 90 min following a final context test (5 min) without reward delivery. All mice were SST-Cre::Ai9.
(B) Group comparison of entries into the sucrose delivery port as a function of conditioning and extinction.
(C) Port entries during 5 min context test where sucrose was omitted in all groups. Port entries during test: χ2 = 10.2, p < 0.001, Kruskal-Wallis ANOVA.
(D) c-Fos (red) and SST (green) labeling in the vCA1. Arrows indicate co-labeled cells.
(E) Group comparisons of vCA1 s.o. cell counts by one-way ANOVA. c-Fos+ cell density: F (2, 9) = 25.8, p < 0.001. c-Fos+/SST-IN density: F (2, 9) = 22.4, p < 0.001. c-Fos+ SST-INs (% total SST-INs): F (2, 9) = 9.40, p < 0.01.
(F) Strategy for targeting of vCA1 SST-INs for photoinhibition with halorhodopsin (NpHR) or opsin-negative control vectors (eYFP only) in SST-FlpO mice.
(G) Representative image of viral expression and optic fiber placement (dashed white line). A solid white box indicates the area of magnification (right).
(H) Design for conditioning and extinction of appetitive responding with photoinhibition test at the indicated time point.
(I) Group comparison of entries into the sucrose delivery port as a function of conditioning and extinction.
(J) Effect of SST-IN photoinhibition on sucrose port entries during a 10 min extinction retrieval test, which was divided into 5 min light-on and light-off epochs, analyzed by two-way repeated measures ANOVA. Opsin 3 epoch interaction during extinction retrieval: F (1, 8) = 19.2, p < 0.01.
(A–E) No Reward: n = 4; Reward Ret: n = 4; Ext Ret: n = 4.
(F–J) eYFP: n = 5; NpHR: n = 5.
*p < 0.05, **p < 0.01, ***p < 0.001 by Dunn’s post hoc test (C), Tukey’s post hoc test (E), or Šídák’s post hoc test (J). Error bars indicate standard error of mean.
