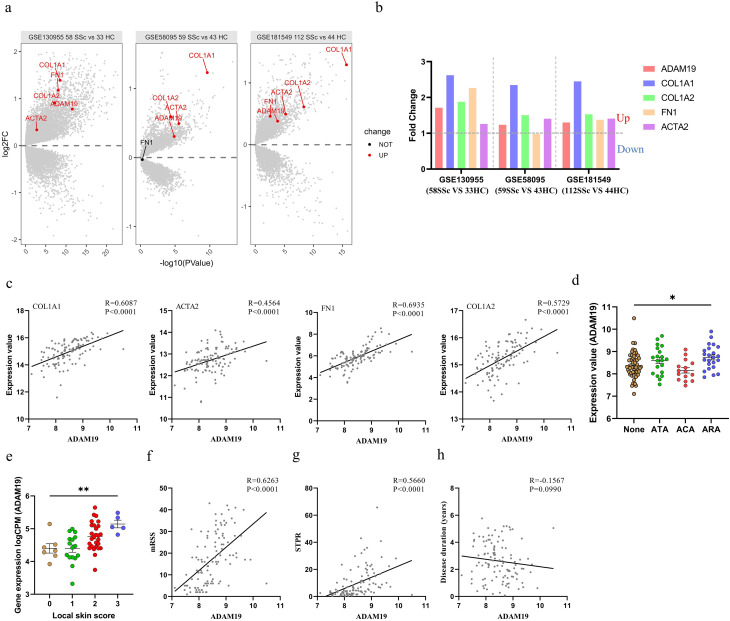
Fig. 1.
ADAM19 expression in skin tissues of SSc patients from GEO datasets. (a) Volcano plots displaying ADAM19 and fibrosis-related genes (ACTA2, COL1A1, COL1A2, and FN1) expression in SSc skin GEO datasets (GSE130955, GSE58095, GSE181549). (b) Fold change ratio for ADAM19 and fibrosis-related genes (ACTA2, COL1A1, COL1A2, and FN1) in SSc skin GEO datasets (GSE130955, GSE58095, GSE181549). (c) Correlation between ADAM19 expression and fibrosis-related genes (ACTA2, COL1A1, COL1A2, and FN1) expression in SSc patients (GSE181549). (d) ADAM19 gene expression levels in skin tissues of SSc patients with negative antibody, and positive for ATA, ACA, and ARA (GSE181549). (e) ADAM19 gene expression levels in skin tissues of SSc patients with different local skin scores (GSE130955). (f) Correlation between ADAM19 expression and mRSS in SSc patients (GSE181549). (g) Correlation between ADAM19 expression and STPR in SSc patients (GSE181549). (h) Correlation between ADAM19 expression and disease duration (years) in SSc patients (GSE181549). SSc, systemic sclerosis; HC, healthy controls; mRSS, modified Rodnan Skin Score; STPR, skin thickness progression rate; ATA, antibodies to DNA topoisomerase I; ARA, antibodies to RNA polymerases; ACA, antibodies to centromere; red color, up-regulated genes; blue color, down-regulated genes. Data are represented as mean ± SEM. **, P < 0.01. ****, P < 0.0001

