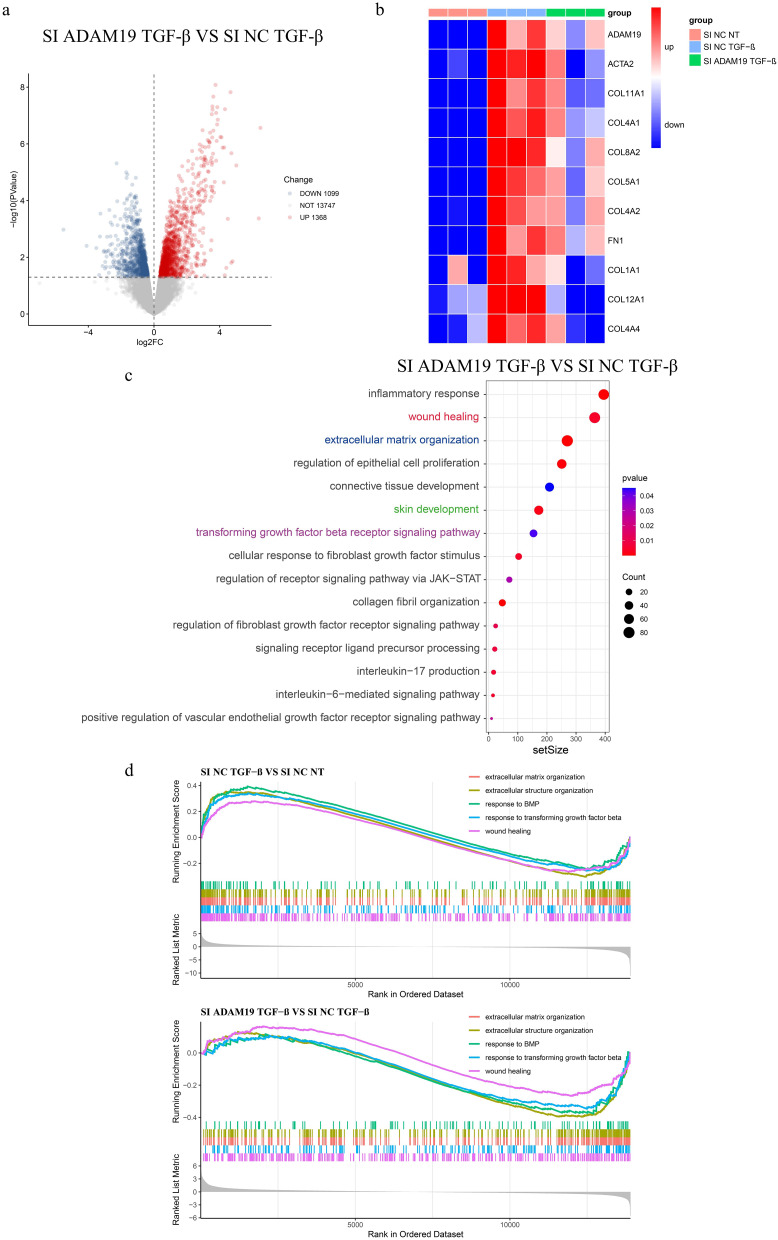
Fig. 4.
Knockdown of ADAM19 inhibited collagen formation and fibroblast activation. (a) Volcano plot of different expression genes (DEGs) between SI ADAM19 TGF-β and SI NC TGF-β. (b) Heatmap displaying ADAM19 and collagen genes expression in human primary dermal fibroblasts isolated from HC transfected with negative control siRNA and ADAM19 siRNA with or without TGF-β (10ng/ml) stimulation for 48 h. (c) GSEA between SI ADAM19 TGF-β and SI NC TGF-β. (d) Enrichment scores of GSEA related to fibroblast activation and fibrosis in Si NC TGF-β vs. Si NC NT and Si ADAM19 TGF-β vs. Si NC TGF-β. HC, healthy controls

