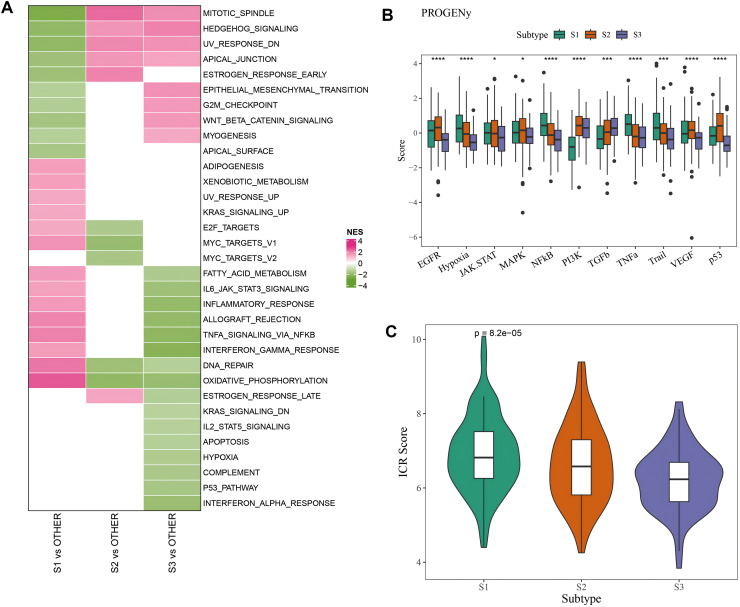
Figure 2. Pathway characteristics analysis between three molecular subtypes.
(A) GSEA analysis of three molecular subtypes in AC-ICAM cohort. (B) Differences in carcinogenic pathway activity among three subtypes. ANOVA was used to compare the overall differences between the three subtypes (S1, S2 and S3). (C) ICR score differences among three subtypes (*p < 0.05, ***p < 0.001, and ****p < 0.0001).

