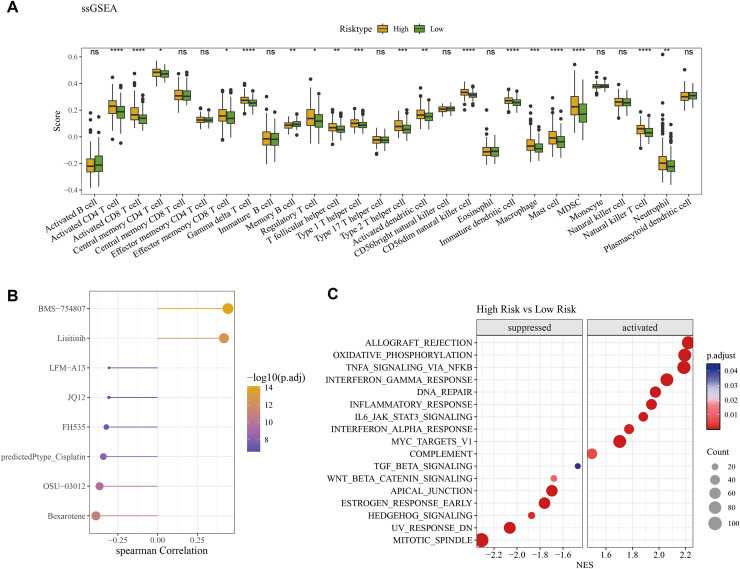
Figure 6. Difference of immune microenvironment of two risk groups and the drug sensitivity analysis.
(A) Immune infiltration difference among the high and low risk groups. (B) Correlation analysis between the RiskScore and its potential drugs. (C) The GSEA analysis among the high and low risk groups. (*p < 0.05, **p < 0.01, ***p < 0.001, and ****p < 0.0001).

