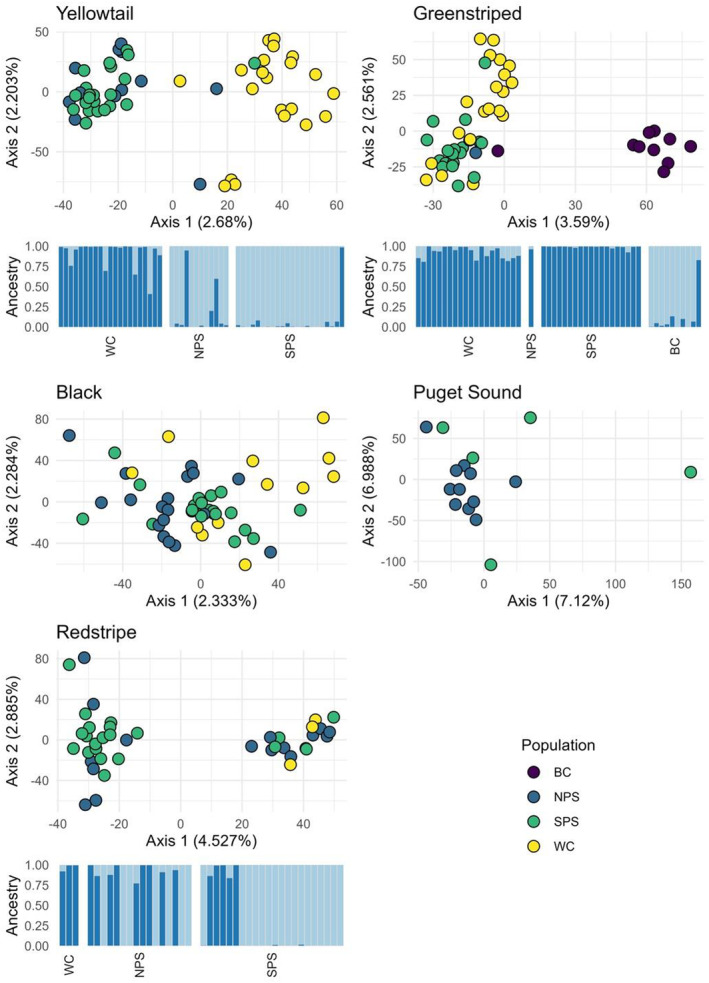
FIGURE 2.

PCA and STRUCTURE plots of five rockfish species suggest different structuring patterns. For the STRUCTURE plots, each bar represents an individual, and the colour represents the genetic cluster to which each fish was assigned. Regions are ordered from the coast (WC), into Puget Sound from the north (NPS) to the south (SPS) and British Columbia (BC). Individuals within each location are ordered from south to north. For the PCAs, each point represents an individual fish, coloured by their sampling location. There are no STRUCTURE plots for Puget Sound and Black Rockfish because only one cluster was discovered.
