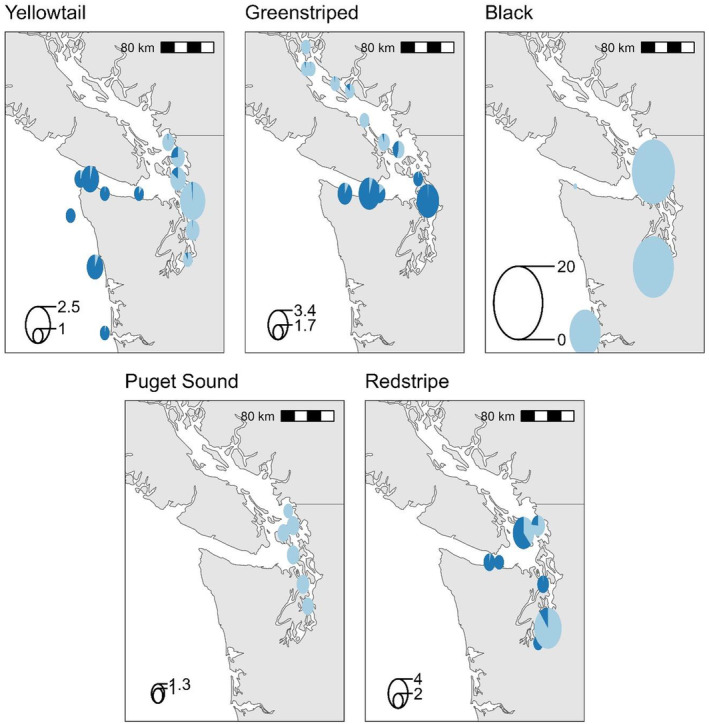
FIGURE 3.

Geographic distribution of STRUCTURE clustering for five species of rockfish. Pie charts are coloured according to STRUCTURE plot results (see Figure 2) and their size shows sample size. The pie segments correspond to the average individual admixture proportions in each collection. Similar capture coordinates were pooled into the same pie.
