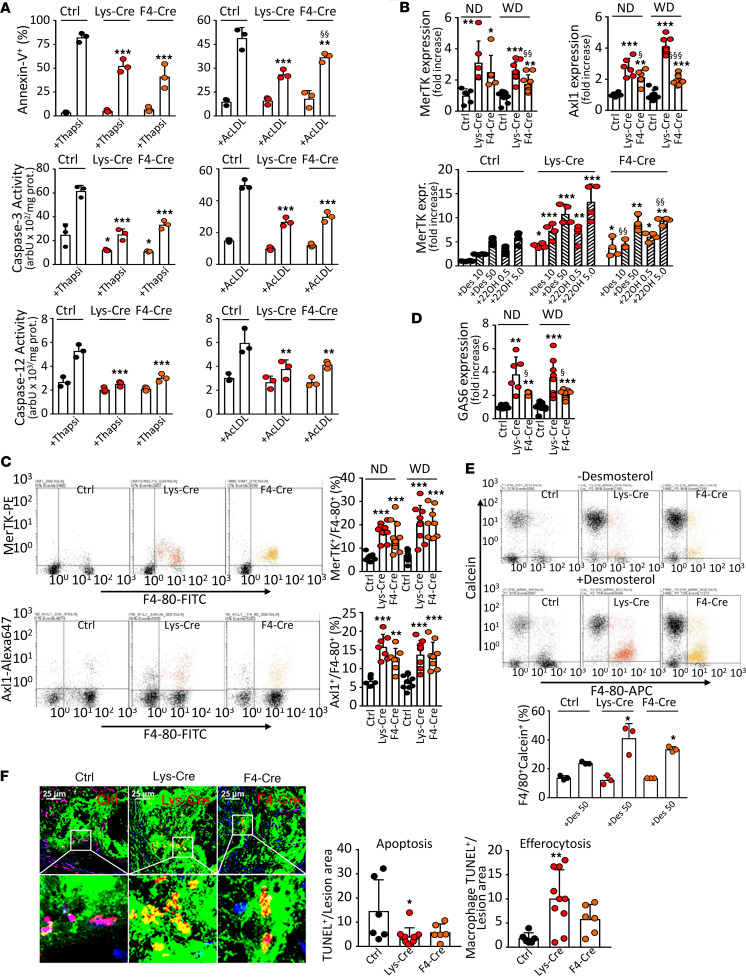
Figure 5. S1P1 overexpression in macrophages inhibits ER stress–dependent apoptosis and enhances efferocytosis.
PMs from S1pr1-KI (Ctrl, n = 6–10), S1pr1-LysMCre (Lys-Cre, n = 6–10), or S1pr1-F4/80Cre (F4-Cre, n = 6–10) mice on ND or Ldlr–/– mice transplanted with S1pr1-KI (n = 10–11), S1pr1-LysMCre (n = 9), or S1pr1-F4/80Cre (n = 9) BM on WD. (A) PMs from ND-fed mice exposed for 24 hours to thapsigargin/fucoidan (Thapsi, 0.5 μmol/L and 25.0 μg/mL) or acetylated LDL (AcLDL, 100.0 μg/mL). Percentage of apoptotic (annexin V positive) cells and caspase-3 and -12 activities (n = 3 for each group). (B) qPCR of Mertk and Axl1 mRNA normalized to Gapdh and presented relative to S1pr1-KI. Lower panel: Mertk in PMs from ND-fed mice incubated for 24 hours with desmosterol (10 or 50 μmol/L) or 22-hydroxycholesterol/9-cis-retinoic acid (0.5 and 5.0 μg/mL, n = 4 for each group). (C) MerTK and Axl1 analyzed by flow cytometry. (D) qPCR of Gas6. (E) Dot plots showing efferocytosis of apoptotic RAW264.7 cells (ATCC) by PMs from ND-fed mice incubated for 24 hours with or without desmosterol (50 μmol/L). RAW264.7 cells and PMs were labeled with calcein and anti–F4/80-FITC (n = 3 for each group). (F) Aortic root section images with apoptotic cells labeled by TUNEL (red), macrophages by anti–MOMA-2 (green), and nuclei by DAPI (blue). Apoptotic cells appear violet (red on blue), and efferocytotic cells appear yellow (red on green, n = 5–10 for each group). The side of the square inset box measures 36 µm. * - P < 0.05, ** - P < 0.01, *** - P < 0.001 (Lys-Cre vs. Ctrl or F4-Cre vs. Ctrl), § - P < 0.05, §§ - P < 0.01, §§§ - P < 0.001 (Lys-Cre vs. F4-Cre, 1-way or 2-way ANOVA except B Axl1/WD, D ND and WD, and F Apoptosis: Kruskal-Wallis h test).

