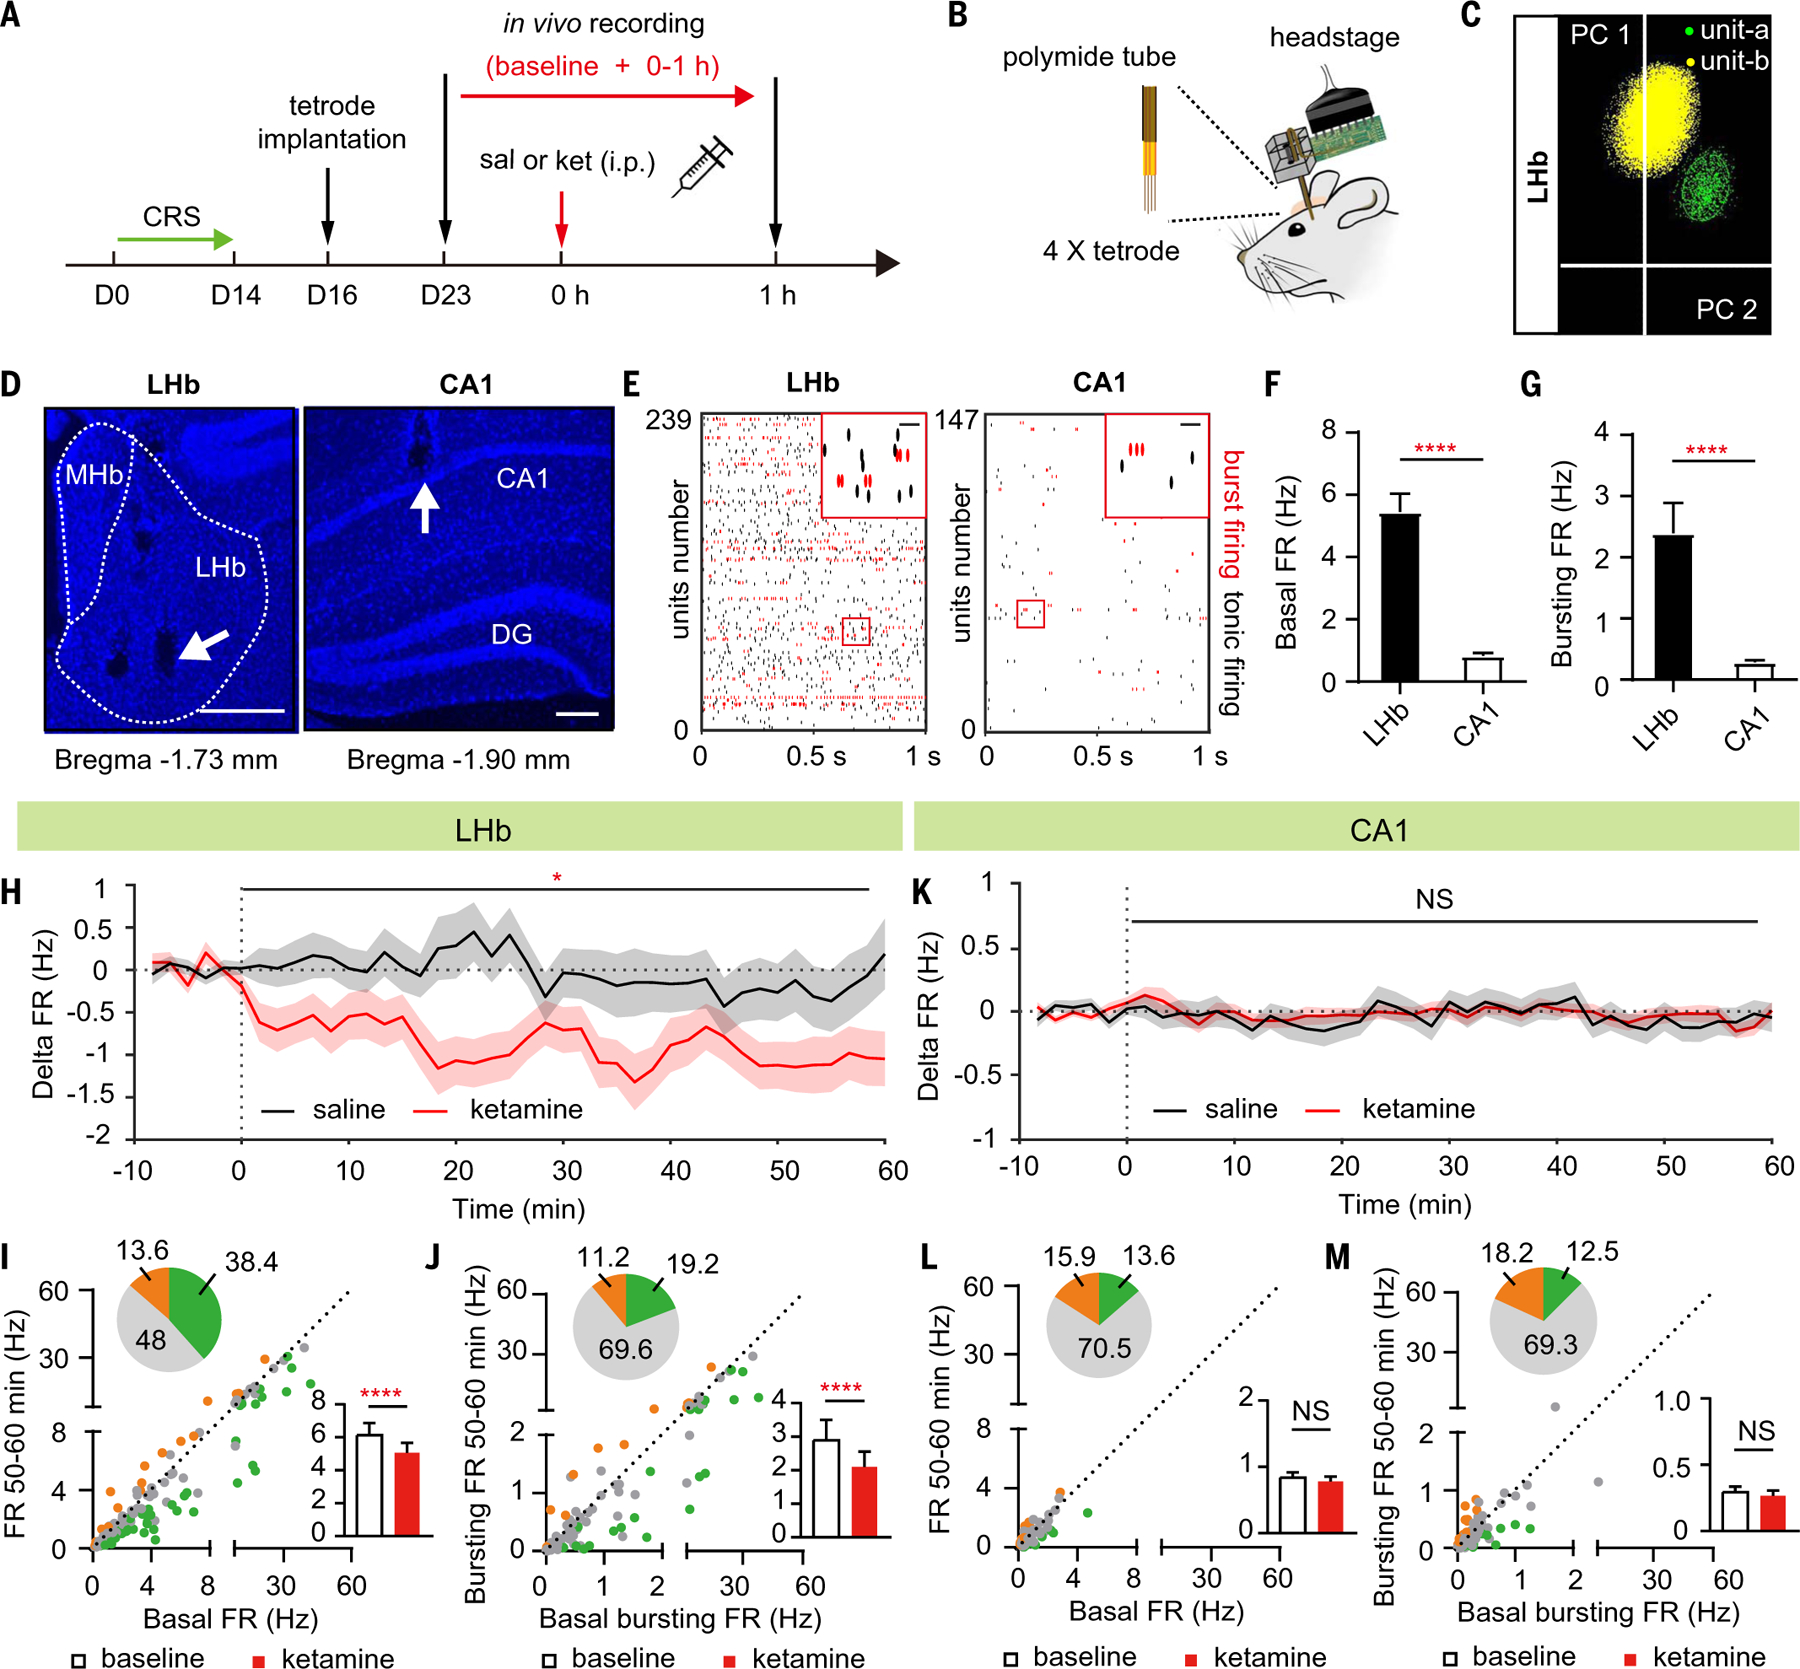
Fig. 2. Systemic ketamine injection in depressive-like mice rapidly inhibits the activity of LHb neurons, but not hippocampal CA1 PYR neurons, in vivo.

(A) Experimental paradigm for in vivo recording after intraperitoneal injection of saline or ketamine (10 mg/kg) in CRS mice. (B) Illustration of in vivo tetrode recording. (C) Principal component analysis clustering display of two well-isolated single units in LHb (yellow and green clusters). (D) Example recording sites stained with DAPI. White dotted lines demarcate the medial habenula (MHb) and LHb. White arrows indicate tetrode tracks. Scale bar, 200 µm. DG, dentate gyrus. (E) Raster of sample basal firing of all recorded LHb and CA1 PYR neurons (red indicates bursting firing). Top right: magnified images of the red square area on the left. Scale bar, 20 ms. (F and G) Bar graphs illustrating the basal FR (spike number per second) [P < 0.0001, Mann-Whitney test (F)] and bursting FR (bursting spike number per second) [P < 0.0001, Mann-Whitney test (G)] in LHb neurons and CA1 PYR neurons. n = 239 units in 15 mice in LHb; n = 147 units in 10 mice in CA1. (H and K) Delta firing rate (FRreal time – FRbaseline) in LHb neurons (H) and CA1 PYR neurons (K) after intraperitoneal injection of saline or ketamine (10 mg/kg) in CRS mice. Bin: 100 s. (I and L) Scatter plots of the FR of recorded LHb neurons (I) and CA1 PYR neurons (L) at baseline state plotted against FR at 50 to 60 min after intraperitoneal injection of ketamine. Green, gray, and orange dots indicate neurons showing significant inhibition, no change, and significant increase of FR, respectively. Pie graphs show the percentage of inhibited (green), excited (orange), and unchanged (gray) units. Bar graphs show the FR in LHb neurons [P < 0.0001, Wilcoxon matched-pairs test (I)] and CA1 PYR neurons [P = 0.43, Wilcoxon matched-pairs test (L)] in CRS mice at 50 to 60 min after intraperitoneal injection of ketamine. (J and M) Scatter plots of the bursting FR of recorded LHb neurons (J) and CA1 PYR neurons (M) at baseline state plotted against bursting FR at 50 to 60 min after intraperitoneal injection of ketamine. Pie graphs show the percentage of inhibited (green), excited (orange), and unchanged (gray) units. Bar graphs illustrate the bursting FR in LHb neurons [P < 0.0001, Wilcoxon matched-pairs test (J)] and CA1 PYR neurons [P = 0.47, Wilcoxon matched-pairs test (M)] in CRS mice at 50 to 60 min after intraperitoneal injection of ketamine. (H) to (M), n = 114 cells in 14 mice in saline group and n = 125 cells in 14 mice in the ketamine group in LHb; n = 59 cells in eight mice in the saline group and n = 88 cells in eight mice in the ketamine group in CA1. *P < 0.05; ****P < 0.0001; NS, not significant. Error bars indicate SEM.
