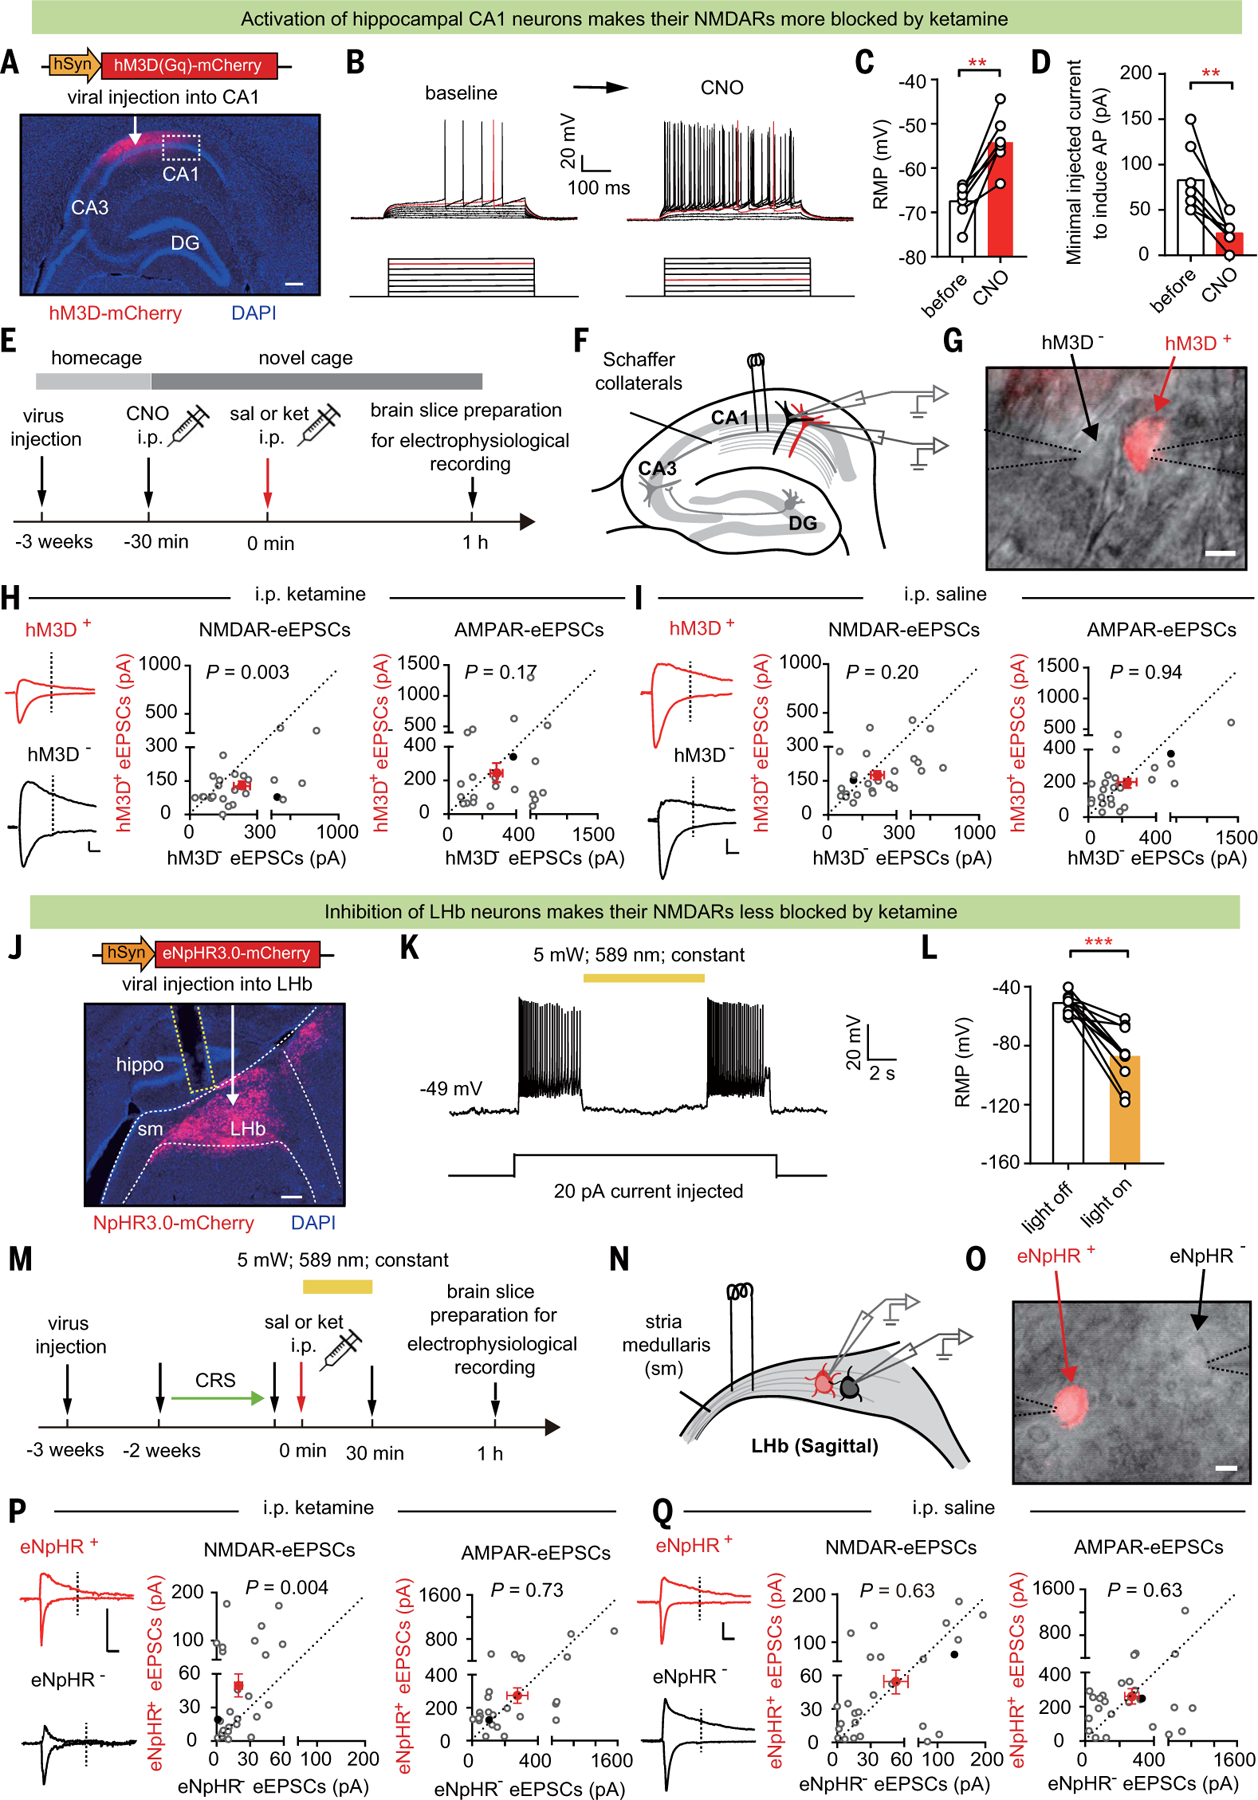
Fig. 4. Activation of CA1 and inhibition of LHb swap their sensitivity to ketamine blockade.

(A) Immunostaining showing the expression of hM3D in CA1. White arrow indicates site of AAV-hM3D-mCherry virus injection. White dashed box indicates the infection border for whole-cell patch recording. Scale bar, 200 μm. (B) Current-voltage relationship of an hM3D-viral-infected CA1 PYR neuron recorded before and after 5 mM CNO perfusion. Raw traces show individual voltage responses to a series of 500-ms current pulses from 0 to 140 pA in 20-pA steps. Red traces indicate the minimal current to induce action potentials. (C) Resting membrane potential (RMP) before and after 5 µM CNO perfusion (n = 7 cells; P = 0.001, paired t test). (D) Minimal injected current to induce action potential (AP) before and after 5 µM CNO perfusion (n = 7 cells; P = 0.004, paired t test). (E) Experimental paradigm recording of CA1 PYR neurons in brain slices prepared 1 hour after intraperitoneal injection of saline or ketamine (10 mg/kg) in mice expressing hM3D-mCherry in CA1 PYR neurons, with CNO (1 mg/kg) intraperitoneal injection 30 min before ketamine administration. (F) Schematic of stimulation electrode placement and paired-recording of neighboring hM3D+ (red) and hM3D– (black) PYR neurons in CA1. (G) Patchclamp recording of a pair of transfected hM3D+ and neighboring untransfected hM3D– CA1 PYR neurons under transmitted and fluorescent light microscopy. Dotted lines indicate the patch pipettes. Scale bar, 10 µm. (H and I) Left: eEPSCs in recorded hM3D+ and hM3D– CA1 PYR neuron pairs. Scale bar, 20 ms, 100 pA. Right: scatter plots of NMDAR-eEPSCs [P = 0.003, Wilcoxon matched-pairs test (H); P = 0.20, Wilcoxon matched-pairs test (I)] and AMPAR-eEPSCs [P = 0.17, Wilcoxon matched-pairs test (H); P = 0.94, Wilcoxon matched-pairs test (I)] recorded at 0.75-mA stimulation intensity in recorded hM3D+ and hM3D– CA1 PYR neuron pairs after intraperitoneal injection of saline (I) or ketamine (H) (n = 25 cell pairs in three mice in the saline group and 24 cell pairs in four mice in the ketamine group). Red dots indicate the averaged values of all recorded cells, and solid black dots indicate the example cells. (J) White arrow indicates site of AAV-eNpHR3.0-mCherry virus injection. Immunostaining showing expression of eNpHR3.0 in LHb. White dashed lines indicate the LHb. Sm: stria medullaris. Yellow dashed lines indicate the optic fiber. Scale bar, 200 μm. (K) Inhibitory effect of yellow light (589 nm) on eNpHR3.0-expressing LHb neurons. Shown is a sample trace of whole-cell recording in LHb neurons under current-clamp mode with 20-pA current injected. (L) RMP of LHb neurons during lights off and lights on (n = 10; P = 0.0003, paired t test). (M) Experimental paradigm. (N) Schematic of stimulation electrode placement and paired-recording of neighboring eNpHR+ (red) and eNpHR– (black) neurons in LHb. (O) Patch-clamp recording of a pair of transfected eNpHR+ and neighboring untransfected eNpHR– LHb neurons under transmitted and fluorescent light microscopy. Dotted lines indicate the patch pipettes. Scale bar, 10 µm. (P and Q) Left: example traces of evoked EPSCs in recorded eNpHR+ and eNpHR– LHb neuron pairs. Scale bar, 10 ms, 100 pA. Right: scatter plots of NMDAR-eEPSCs [P = 0.004, Wilcoxon matched-pairs test (P); P = 0.63, Wilcoxon matched-pairs test (Q)] and AMPAR-eEPSCs [P = 0.73, Wilcoxon matched-pairs test (P); P = 0.63, Wilcoxon matched-pairs test (Q)] recorded at 1.5-mA stimulation intensity in recorded eNpHR+ and eNpHR– LHb neuron pairs after intraperitoneal injection of saline (Q) or ketamine (P). n = 26 cell pairs in seven mice in the saline group and n = 26 cell pairs in seven mice in the ketamine group. Red dots indicate the averaged values of all recorded cells, and solid black dots indicate the example cells. **P < 0.01; ***P < 0.001; NS, not significant. Error bars indicate SEM.
