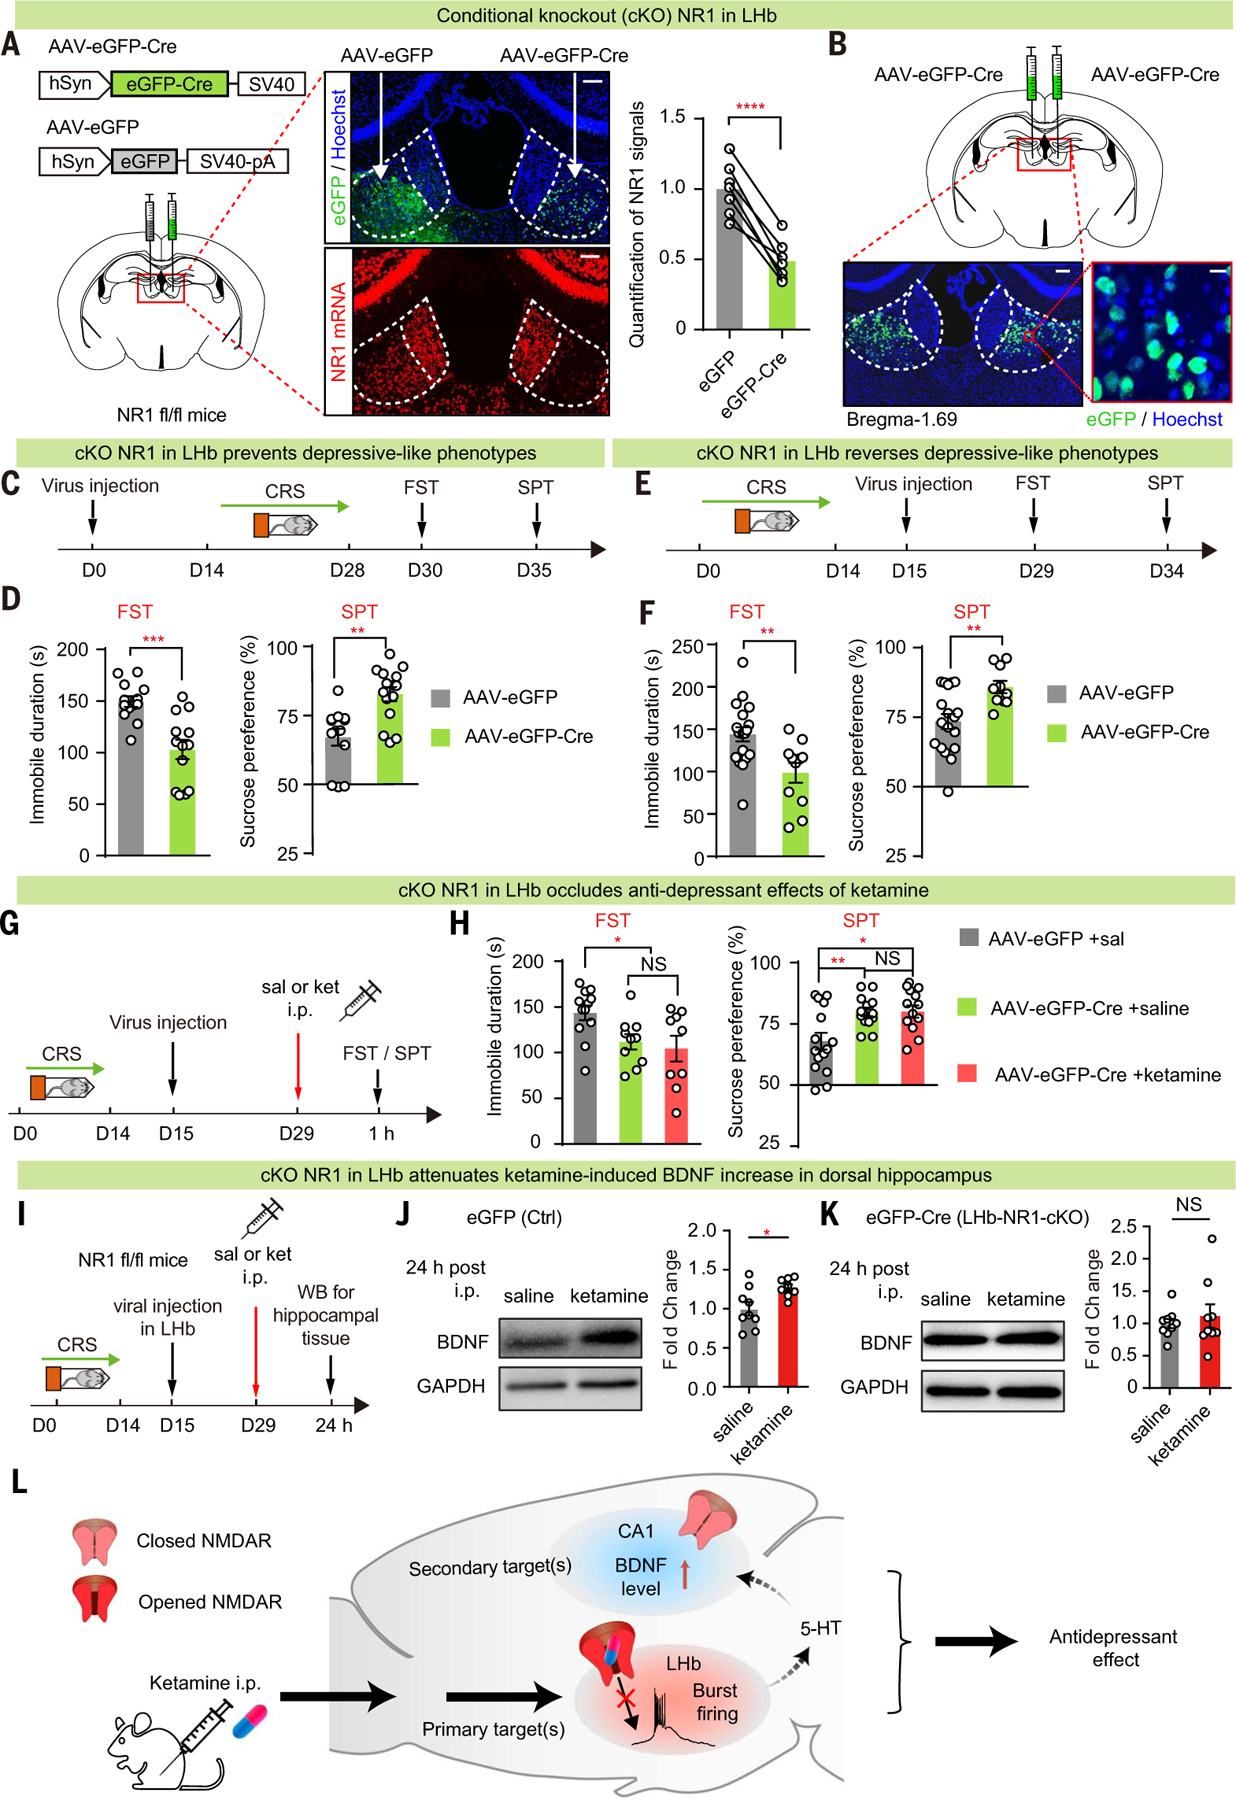
Fig. 6. Local knockout of NR1 in LHb is sufficient to have an antidepressant effect and occludes ketamine’s anti-depressant effects.

(A) Left: schematics of viral constructs and injection of AAV virus expressing eGFP on one side and Cre in the other side of the LHb of NR1 flox/flox (NR1 fl/fl) mice. Middle: viral expression (top) and RNAscope staining of NR1 (bottom) in brain slices expressing AAV-eGFP and AAV-eGFP-Cre in one of the two sides of the LHb. Scale bars, 100 µm. Right: quantification of NR1 signals to estimate knockout efficiency (n = 7 for AAV-eGFP-Cre and AAV-eGFP; P < 0.0001, paired t test). (B) Illustration of bilateral viral injection of AAV-eGFP-Cre in LHb of NR1 fl/fl mice stained with Hoechst. Scale bars, 100 µm (left) and 10 µm (right). (C, E, and G) Experimental paradigm for behavioral testing with virus injected in the LHb before (C) or after [(E) and (G)] induction of CRS. (G) Ketamine (10 mg/kg) was intraperitoneally injected 1 hour before FST or SPT. (D, F, and H) Depressivelike behaviors in FST [P = 0.0002, n = 13, 13 (D); P = 0.004, n = 19, 11 (F); n = 12, 10, 9 (H), eGFP + saline versus Cre + saline P = 0.01, Cre + saline versus Cre + ketamine P = 0.65, eGFP + saline versus Cre + ketamine P = 0.02] and SPT [P = 0.002, n = 13, 15 (D); P = 0.005, n = 18, 10 (F); n = 15, 13, 12 (H), eGFP + saline versus Cre + saline P = 0.007, Cre + saline versus Cre + ketamine P = 0.95, eGFP + saline versus Cre + ketamine P = 0.01]. (I to K) Experimental paradigm (I) and Western blot analysis [(J) and (K)] of dorsal hippocampal BDNF 24 hours after intraperitoneal injection of ketamine (10 mg/kg) in control (J) or LHb-NR1-cKO (K) mice [P = 0.02 (J); P = 0.98 (K)]. GAPDH was used as a loading control. For control, n = 9 mice in the saline group and n = 8 mice in the ketamine group; for cKO, n = 9 mice in the saline group and n = 9 mice in the ketamine group. (L) Schematic model illustrating the primary and secondary brain targets of ketamine in mediating its antidepressant effects. *P < 0.05; **P < 0.01; ***P < 0.001; ****P < 0.0001; NS, not significant. Error bars indicate SEM.
