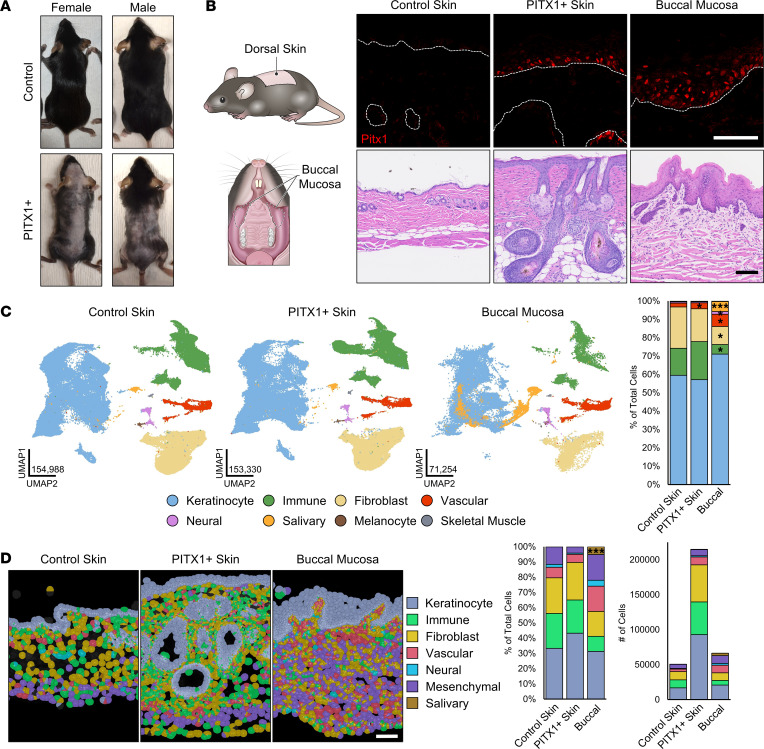
Figure 1. scRNA-Seq and Xenium in situ analysis of control skin, PITX1+ skin, and buccal mucosa.
(A) Representative dorsal images of male control and PITX1+ male and female mice. (B) Schematic of tissues collected (left). Representative immunofluorescent (IF) stainings for PITX1 (shown in red) and DAPI (shown in blue) in control epidermis, PITX1+ epidermis, and buccal epithelium. Dotted lines denote dermal-epidermal junction (DEJ) (top, middle). Representative H&E of tissues (bottom). Scale bars = 100 μm. (C) Uniform manifold approximation and projections (UMAPs) and cell type annotations of whole skin scRNA-Seq (left) and proportion plot of cell types in each condition (right). n = 8 control mice, 8 PITX1+ mice, 7 buccal mucosae pools. (D) Xenium in situ representative images of male FFPE skin sections with Xenium-derived cell types highlighted. n = 3 control skin, 4 PITX1+ mice, 7 buccal mucosae; scale bar = 100 μm (left). Proportion plot and total number of each cell type in each condition (right). Significance for proportion plots was assessed by proportionality testing followed by ad hoc comparisons against the corresponding cell type in control skin to derive log2 fold-change (log2FC) (*P < 0.01 & log2FC > |1.5|, ***P < 0.01 & log2FC > |4|).

