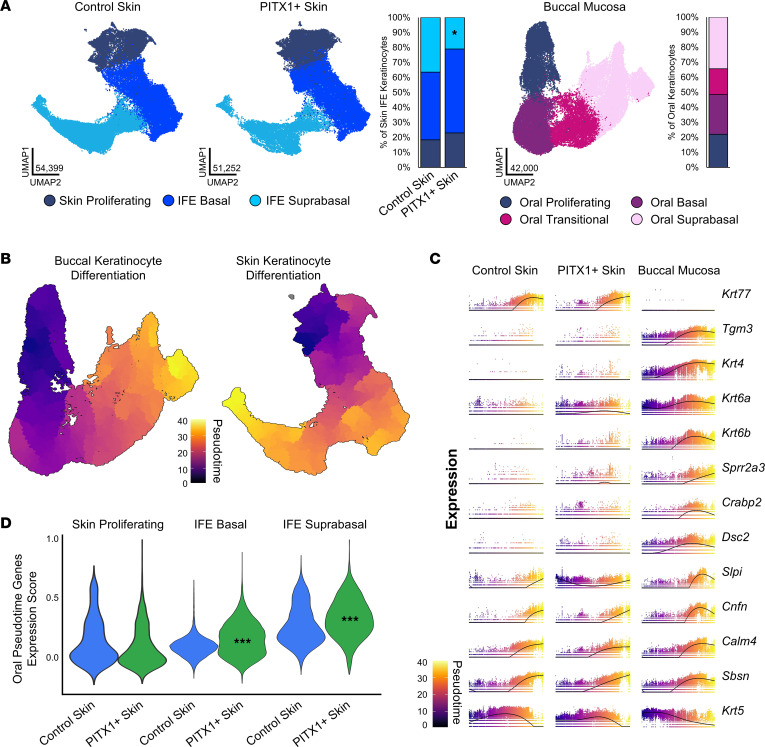
Figure 2. PITX1 reprograms epidermal interfollicular keratinocyte subtypes.
(A) UMAPs of control skin and (n = 8) PITX1+ (n = 8) interfollicular epidermal (IFE) keratinocyte subpopulations and proportion plot (left). UMAP of buccal keratinocyte (n = 7) subpopulations and proportion plot (right). Significance for skin proportion plot was assessed by proportionality testing followed by ad hoc comparisons against the corresponding cell type in control skin to derive log2 fold-change (log2FC) (*P < 0.01 & log2FC > |1.5|). (B) Pseudotime trajectory plots of buccal (left) and integrated IFE keratinocyte data sets (right). (C) Plots illustrating gene expression as a function of pseudotime of individual cells (dots) in each condition. Line indicates average gene expression over pseudotime. (D) Violin plots of the relative expression of the top oral differentiation-associated genes in skin IFE subpopulations. Data are shown as the distribution of relative expression scores for individual cells for each condition. Significance in each skin subpopulation was determined by pairwise Wilcoxon’s rank sum tests with Benjamini-Hochberg multiple comparisons correction (***P < 0.001).

