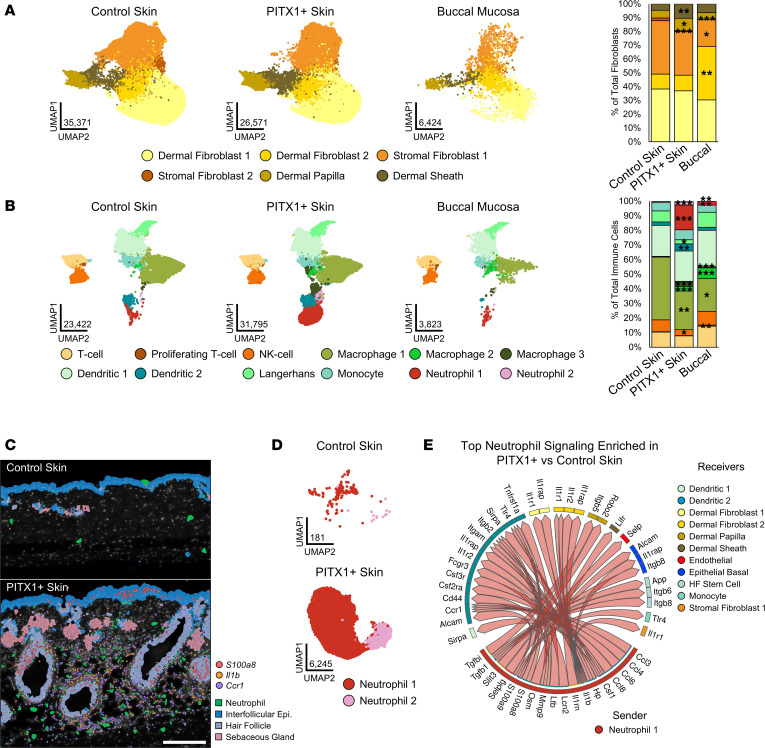
Figure 4. PITX1 expression alters the balance of fibroblasts and immune cells in the skin.
(A) UMAPs of fibroblast subpopulations in control skin (n = 8), PITX1+ skin (n = 8), and buccal mucosa pools (n = 7) (left). Proportion plot of fibroblast subpopulations (right). (B) UMAPs of immune cell subpopulations in control skin (n = 8), PITX1+ skin (n = 8), and buccal mucosa pools (n = 7) (left). Proportion plot of immune cell subpopulations (right). Significance for proportion plots was assessed by proportionality testing followed by ad hoc comparisons against the corresponding cell type in control skin to derived log2 fold-change (log2FC) (*P < 0.01 & log2FC > |1.5|, **P < 0.01 & log2FC > |2|, ***P < 0.01 & log2FC > |4|). (C) Representative Xenium of male control skin (n = 3) and PITX1+ skin (n = 4), highlighting neutrophils, IFE keratinocytes, HF keratinocytes, and sebaceous gland keratinocytes. Transcripts of S100a8, Il1b, and Ccr1 are indicated by colored dots. Scale bar = 200 μm. (D) UMAP of control skin and PITX1 skin neutrophil subpopulations. (E) Circos plot showing PITX1+ skin-enriched ligand-receptor (L-R) interactions predicted by MultiNicheNet to originate from Neutrophil 1 subpopulation (sender). Arrows point to cell subpopulations that are predicted to be engaged by Neutrophil 1 (receivers). Genes constituting predicted signaling pairs are listed on outside of plot.

