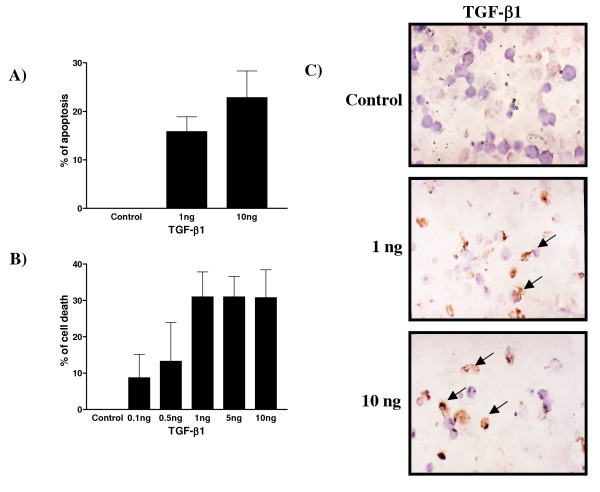
Figure 7.
Effect of TGF-β1 (ng/ml) on cell survival in cultured rat endometrial cells as demonstrated by Hoechst staining, TUNEL and trypan blue exclusion analyses. A) Apoptosis as determined by Hoechst nuclear staining. Data represent the mean ± SEM of six independent experiments. All doses are significantly different from control (p < 0.001). B) Cell viability as determined by trypan blue exclusion assay. Data represent the mean ± SEM of six independent experiments. 1, 5 and 10 ng/ml TGF-β1 doses are significantly different from control (p < 0.0001). C) Apoptosis as determined by TUNEL assay. Representative fields are presented out of 6 experiments. Arrows indicate positive staining.

