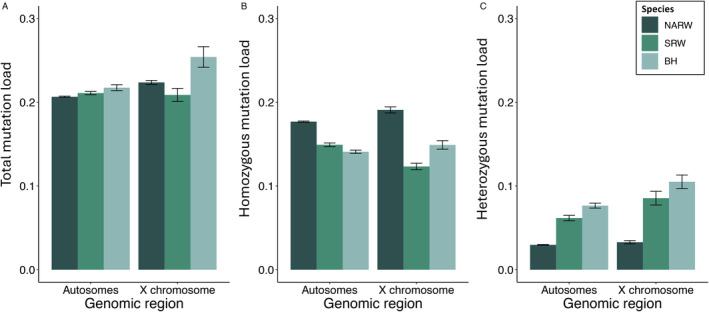
FIGURE 2.

Estimates of mutation load across Balaenidae whales for autosomes and the X chromosome. Species are colored as depicted in the legend and genomic region is labeled along the X axis for (A) Total mutation load, (B) homozygous mutation load, and (C) heterozygous mutation load. Error bars are (±) one standard error.
