FIGURE 3.

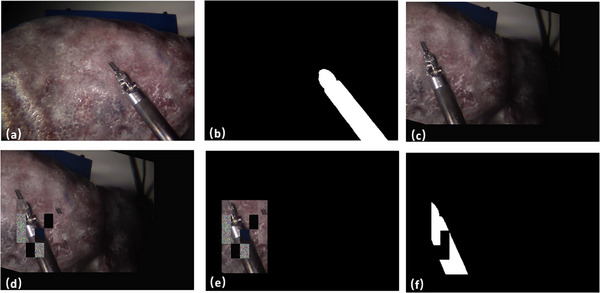
Data Augmentation Process. (a) represents the raw image. (b) Raw Segmentation Mask. (c) represents regular augmentation. (d) Patch Occlusions. (e) Mask out of the background. (f) Augmented Segmentation Mask.

Data Augmentation Process. (a) represents the raw image. (b) Raw Segmentation Mask. (c) represents regular augmentation. (d) Patch Occlusions. (e) Mask out of the background. (f) Augmented Segmentation Mask.