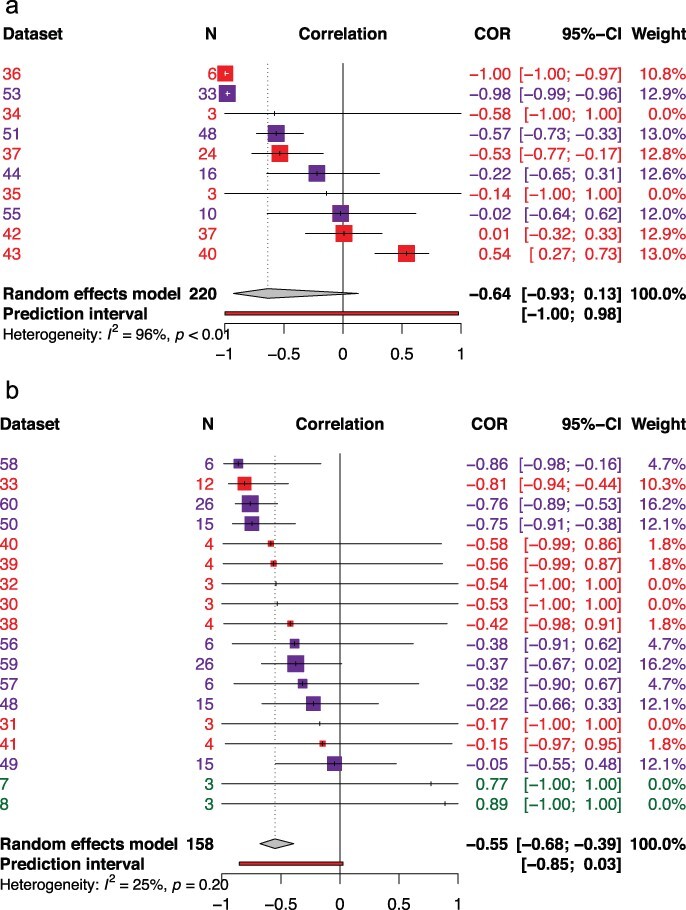
Figure 2.

Forest plots displaying the distribution of effect sizes (correlations) for the life history theory (a), and the generalism–specialism dichotomy (b). The gray diamonds represent the pooled correlations, evolution of virulence (R = 0.15), life history theory (R = −0.64), and the generalism–specialism dichotomy (R = −0.55). The life history framework is mainly represented by negative correlations, which implies a tradeoff between survival and reproduction with animal viruses represented by datasets 34, 35, 36, 37, 42, and 43 and bacteriophages represented by datasets 44, 51, 53, and 55. Animal viruses in the generalism–specialism dichotomy are represented by datasets 30, 31, 32, 33, 38, 39, 40, and 41 while bacteriophages are represented by datasets 48, 49, 50, 56, 57, 58, 59, and 60. Datasets 7 and 8 represent plant viruses. Across panels, bacteriophage data sets are color-coded in purple, animal viruses in red, and plant viruses in green.
