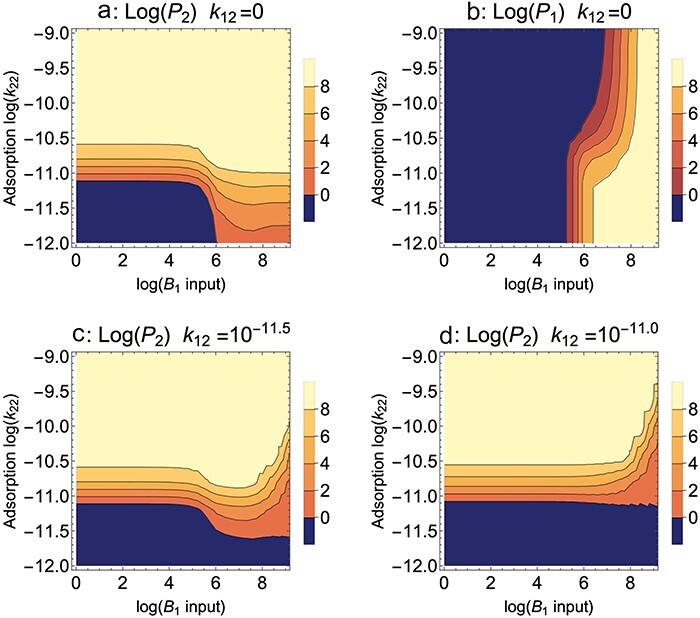
Figure 1.

B 2 blocks adsorption, Mixed presentation. Contour plots of the densities of the mutant phage (P2) and wild type (P1) after 10 h of propagation; the color key gives log10 densities of the phage indicated by the panel title (/ml). The fate of a single phage is shown in separate panels as a property of permissive host input to each cycle (B1, X-axis) and of the adsorption rate of the mutant phage to the nonpermissive host (k22, Y-axis). The wild-type phage does not adsorb to the nonpermissive host in (a) and (b), hence k12 = 0. (a) For adsorption rates >10−10.5, the mutant ascends regardless of B1 input. At lower adsorption rates, the mutant benefits from high B1 input. (b) Maintenance of the wild-type phage is affected by competition from the mutant phage. The lower part of the panel (the smallest k22 values and high B1 input) shows maintenance of the wild-type phage in absence of strong competition from the mutant, because the mutant does not reach high values there (from (a)). High k22 values expand the zone of wild-type loss, due to competitive exclusion by the mutant phage. (c, d) The benefit of high B1 for mutant evolution fades and becomes detrimental if the wild-type phage grows partially on B2. k12 = 10−11.5 for (c). k12 = 10−11.0 for (d). Bacterial growth rate = 0.02/min, cycle length = 50 min, dilution = 1/10, all burst sizes = 50, all transition rates from the infected state to burst = 0.05/min, adsorption rates of both phages to the permissive host = 10−9 ml/min. Per cycle input of the nonpermissive host B2 is 108; initial value of the wild-type phage = 108 and that of the mutant phage = 1 (introduced at 8 min).
