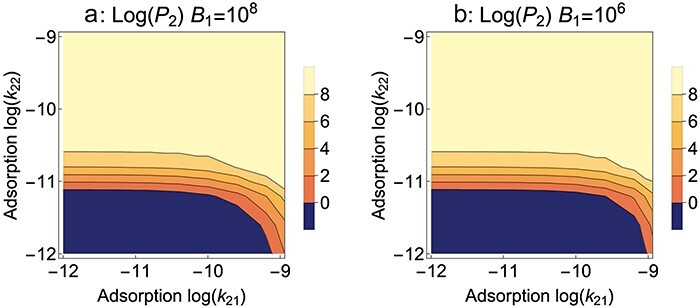
Figure 3.

B 2 blocks adsorption, Mixed presentation. Contour plots of mutant phage evolution after 10 h of serial transfer. In contrast to Figs 1 and 2, here the adsorption rate constants of the mutant phage are allowed to vary on both hosts (k21 on B1 and k22 on B2), and it becomes possible to evaluate the effect of a trade-off in adsorption rates. The wild type has values k11 = 10−9 and k12 = 0, so a trade-off requires that the mutant must have k21 < 10−9 for any increase in k22—its realm of possible values would lie inside the right boundary. It is thus seen that a strong trade-off can thwart mutant evolution because the mutant cannot evolve with strong reductions in k21 and only modest gains in k22 (dark blue zone). However, once the mutant’s adsorption rate on the nonpermissive host exceeds 10−11, reduced adsorption to the permissive host no longer suppresses its evolution. (a) and (b) differ only in the level of B1 input at the beginning of each cycle. There is only a slight effect of B1 input, indicated by the slightly expanded dark blue zone for 106. (The right vertical boundaries of these plots correspond to slices at the appropriate B1 levels in Fig. 1a.) Parameter values are as given in Fig. 1; k12 = 0.
