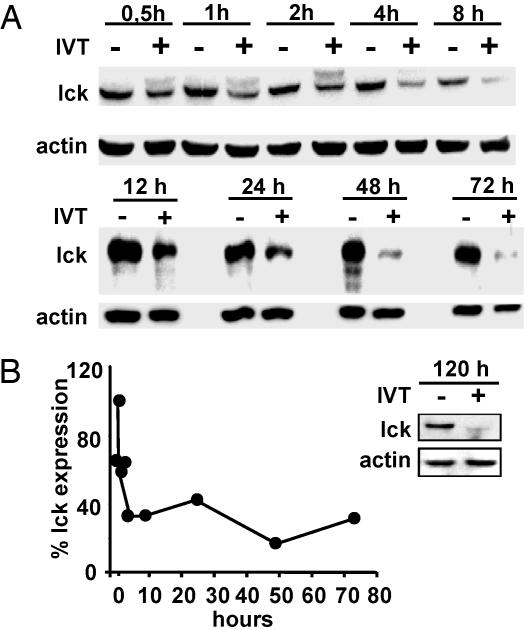
Fig. 2.
Kinetics of lck down-regulation in IVT-specific CTL. BK289 CTLs were activated with IVT-pulsed C1R/A11 cells for the indicated periods of time. Viable cells were counted, harvested, and lysed in SDS sample buffer. (A) Results of one representative immunoblotting experiment with lck-specific Ab. (B) Densitometry of lck-specific bands revealed in lysates of activated CTLs was performed as described above, and band intensities were expressed as the percentage relative to that of controls. Shown is one representative of five experiments.

