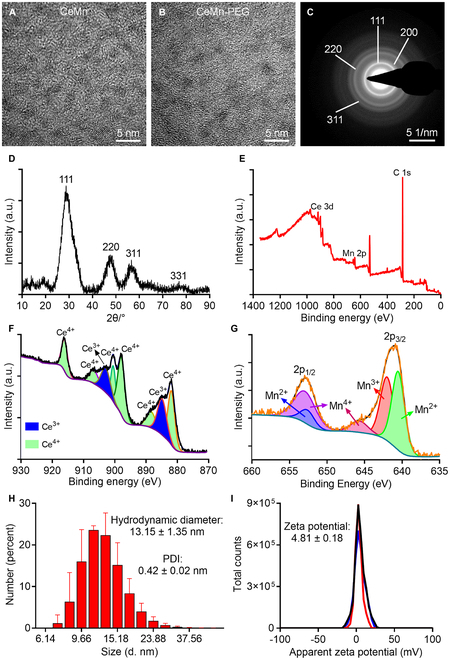
Fig. 2.

Characterization of CeMn NP and CeMn-PEG. Representative TEM image of CeMn NP (A) and CeMn-PEG (B). SAED pattern (C) and XRD (D) of CeMn. (E) Survey scan XPS spectrum of CeMn-NP. (F) XPS spectrum of Ce3d revealed the mixed valence states of Ce3+ (884.88 and 902.89 eV) and Ce4+ (881.89, 888.38, 897,88, 900.48, 906.66, and 916.03 eV). (G) XPS spectrum of Mn2p revealed the mixed valence states of Mn2+ (640.51 and 652.6 eV), Mn3+ (641.99 eV), and Mn4+ (645.69 and 652.91 eV). Hydrodynamic diameter (H) and zeta potential (I) of CeMn-PEG.
