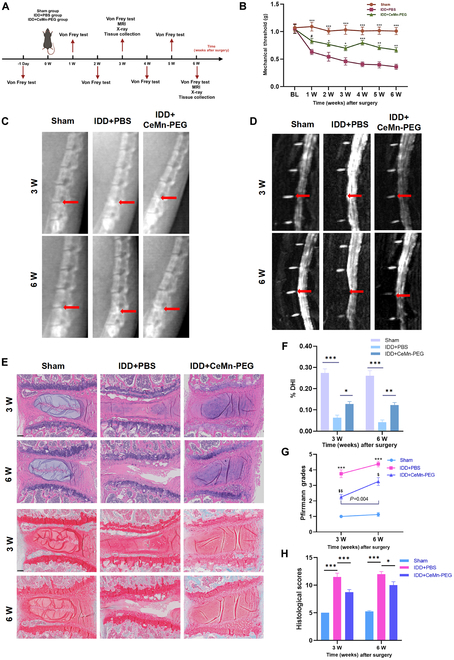
Fig. 7.

CeMn-PEG could ameliorate the puncture-induced degeneration of mouse IVD in vivo. (A) Schematic graph exhibits in vivo experimental procedure including the establishment of the puncture-induced mouse IVD model with injection of 5 μl of PBS or CeMn-PEG (1 μg/ml) and arrangement of behavior test (von Frey test) and imaging examination (MRI and x-ray). Mice were harvested at 3 and 6 weeks after surgery. (B) Paw withdrawal threshold of mice by using von Frey test. Data are presented as the mean ± SEM. #P > 0.05, *P < 0.05, **P < 0.01, ***P < 0.001 relative to the IDD + PBS group, n = 8. (C) Representative radiographs of needle-punctured mouse lumbar disc of each group at 3 and 6 weeks after surgery (red arrows). (D) Representative T2-weighted MRI images of needle-punctured mouse lumbar disc of each group at 3 and 6 weeks after surgery (red arrows). (E) Representative H&E staining and Safranin O/Fast Green staining of disc samples in each group at 3 and 6 weeks after the operation. Scale bar, 100 μm. (F) Disc height index (%DHI) of needle-punctured mouse lumbar disc evaluated according to radiographs in 3 groups at 3 and 6 weeks after surgery. Data are presented as the mean ± SEM. *P < 0.05, **P < 0.01, ***P < 0.001, n = 8. (G) Pfirrmann grade scores of needle-punctured mouse lumbar disc evaluated according to MRI images in 3 groups at 3 and 6 weeks after surgery. Data are presented as the mean ± SEM. ***P < 0.001 relative to the IDD + PBS group, n = 8. $P < 0.05, $$P < 0.01 relative to the sham group, n = 8. (H) Histological grades of needle-punctured mouse lumbar disc evaluated according to H&E staining and Safranin O/Fast Green staining in 3 groups at 3 and 6 weeks after surgery. Data are presented as the mean ± SEM. *P < 0.05, **P < 0.01, ***P < 0.001, n = 8.
