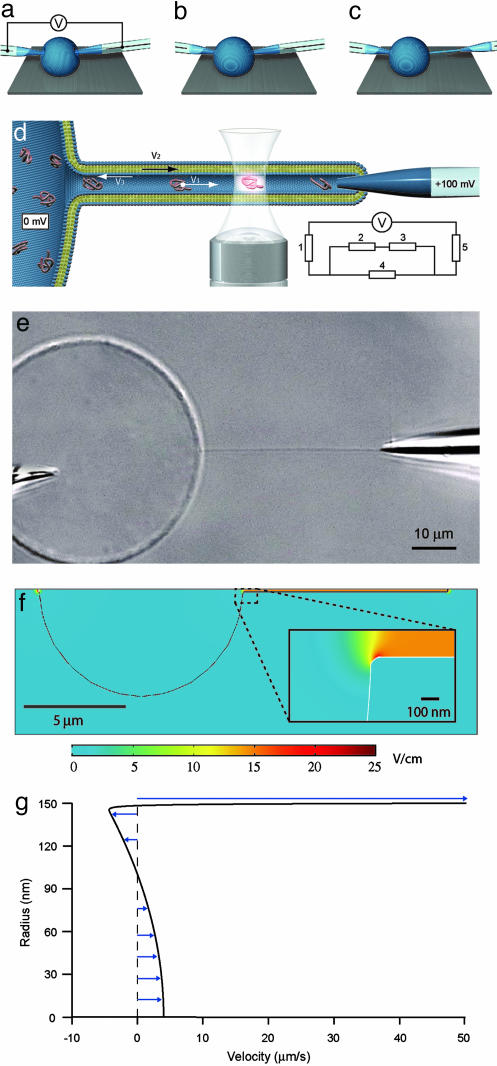
Fig. 1.
Schematics describing nanotube-vesicle network (NVN) formation, geometry of the NVN system, and fluorescence detection used in the experiments and simulations of the field distribution and flow profile. (a) The electrodes are pressed against the membrane of the unilamellar liposome filled with a DNA solution, and an electric pulse is applied. The pulse opens pores in the membrane, allowing the tips of the electrodes to enter into the liposome. (b) The pores in the membrane close, and the membrane seals around the electrode. (c) One of the electrodes is moved out of the unilamellar liposome, pulling a lipid membrane nanotube. (d) Schematic picture of the NVN. The nanotube is aligned across the confocal excitation/detection spot of the confocal microscopy setup, and an electric potential is applied between the electrodes, with the nanotube-coupled electrode having positive potential. The fluorescence signal from the DNA molecules is detected as they pass the excitation/detection spot. V1 is the velocity of the DNA molecules, V2 is the velocity of the membrane, and V3 is the velocity of the electroosmotic flow. Because V2 and V3 cancel each other out (see text), no net liquid flow occurs in the nanotube. (Inset) The equivalence circuit of the electrophoretic system is shown; 1 and 5 represent the electrode resistance (50 MΩ), 2 and 3 represent the vesicle-electrode seal resistance (50 MΩ) and the nanotube-electrode seal resistance (100 MΩ), respectively, and 4 represents the nanotube resistance (>1GΩ), calculated from the buffer conductivity (0.5 S/m) and the nanotube dimensions (L = 40 μm and R = 150 nm). Evaluation of the equivalence circuit gives a potential drop of 60 mV over the nanotube. (e) A Nomarski differential interference contrast microscopy image of a fully formed NVN with electrodes. The unilamellar vesicle is filled with fluorescently labeled DNA molecules. The two electrodes are used both to create the NVN and drive the electric current through it. The length of the nanotube is 40 ± 1 μm. (f) Field strength distribution inside and outside the NVN, modeled with the finite element method program femlab 3.0.(g) Flow profile of axial velocity inside the nanotube, drawn from the nanotube center line to the membrane surface.

