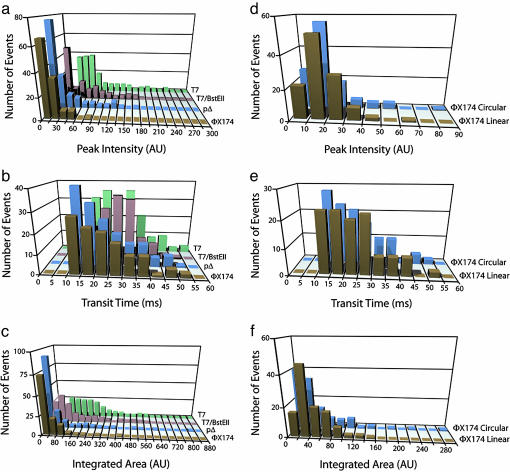
Fig. 3.
Distributions of peak intensity, transit time, and integrated peak area for the different DNA species. Distributions for T4 DNA are not shown because of the small number of observed events (n = 12). (a-c) Distributions of peak intensity (a), transit time (b), and integrated peak area (c) for DNA from φX174, pΔ, T7/BsteII, and T7 (noncleaved) are shown. (d-f) Distributions of peak intensity (d), transit time (e), and integrated peak area (f) for the linear and relaxed circular forms of φX174 DNA. The distributions for T4 DNA are not shown because of the rarity of the detected peaks compared with the other DNA sizes (for which n > 100); only average values (n = 12) of the three parameters are given in Fig. 4.

